The Fifteen · October 2026
Fifteen Langley listings worth a second look.
Chosen by reading all 1,384 of them.
Every active listing in Langley, 1,384 of them, was read on 6 October 2026 and put through the same three tests. The first finds homes with a low asking-price-to-tax ratio against others of their own type in their own neighbourhood, a screening signal for which listings to read and not a valuation. The
second finds homes priced low by the square foot against their own neighbourhood
and property type. The third is not arithmetic at all: land, water, working
ground and houses built before the war. Five from each, and the working is shown
on every one.
One · The Tax Tell
Low asking-price-to-tax ratios.
Every listing prints its annual property tax. Dividing the asking price by that tax gives a ratio, and a listing whose ratio sits well below the median for its own dwelling type in its own neighbourhood is asking less, against the tax it carries, than its neighbours are. That is a screening signal and not a valuation: the bills come from two tax years, a bill can include charges other than the municipal rate, and class and exemptions move it, so a low ratio does not establish that a home is priced below its assessed value. Each card states the comparison group, its size, its median and the day it was read, so the percentage can be reproduced, and the tax report prints every group from the same read.
How these five were chosen
The test.
Take a listing’s asking price and divide it by the annual property tax printed on its own
MLS® sheet. Compare that ratio against the median
ratio for the same dwelling type in the same neighbourhood. A house is only ever measured
against other houses on its own streets, never against condos and never against another sub-area.
Why it works.
Property tax in British Columbia is assessed value multiplied by the municipal rate. Within one municipality the residential rate is the same for everybody, so bills broadly follow assessed values. A ratio well below its group’s is a reason to read the listing, and only that: the Township taxes residential, commercial and farm class at different rates, so each listing is measured only against its own dwelling type in its own neighbourhood (houses against houses, condos against condos, townhouses against townhouses). The listing sheet does not print the tax class, so class is not verified; houses on an acre or more, where farm-class bills are common, are left out, and so is anything whose remarks describe a commercial, mixed-use or farm-status property. Each card shows the gap, the group size, the median ratio and the tax year.
What is excluded, and why.
New construction showing $0 tax or a pre-2025 tax year, because the assessor has not valued it yet
and there is nothing to measure. Any group with fewer than six comparable listings, because a median drawn from four homes is too few to compare against with any confidence. Anything whose ownership or remarks show it is not an ordinary residential holding (a mixed-use or commercial building, a co-operative share, a leasehold, a property described as having farm status), because its tax bill cannot be compared with a residential one. And land assembly sites, whose taxes reflect development
potential rather than the house: those live on the land
page instead. Since October 2026 the screen also leaves off homes built in 2025 or later, lots of an acre or more, age-restricted buildings, and anything priced above 1.4 times its neighbourhood’s median dollars per square foot, because each of those is priced or taxed for something other than the home as it stands. One pick per neighbourhood.
The comparison group, exactly. One read of every active listing, on the afternoon of 6 October 2026 (Pacific). A group is one dwelling type in one neighbourhood search. Counted in a group: freehold or strata ownership, a tax bill of $300 or more on a 2025 or 2026 sheet and, for houses, a lot under one acre. The exclusions in the paragraph above that go further (year built, age restriction, the 1.4 times guard and the remarks) decide which listings can be picked; they do not change the group a pick is measured against.
We publish the ratio, not an assessed value, and we
never call it an assessment. The tax figure comes from the listing sheet, which we are licensed to
display.
 01
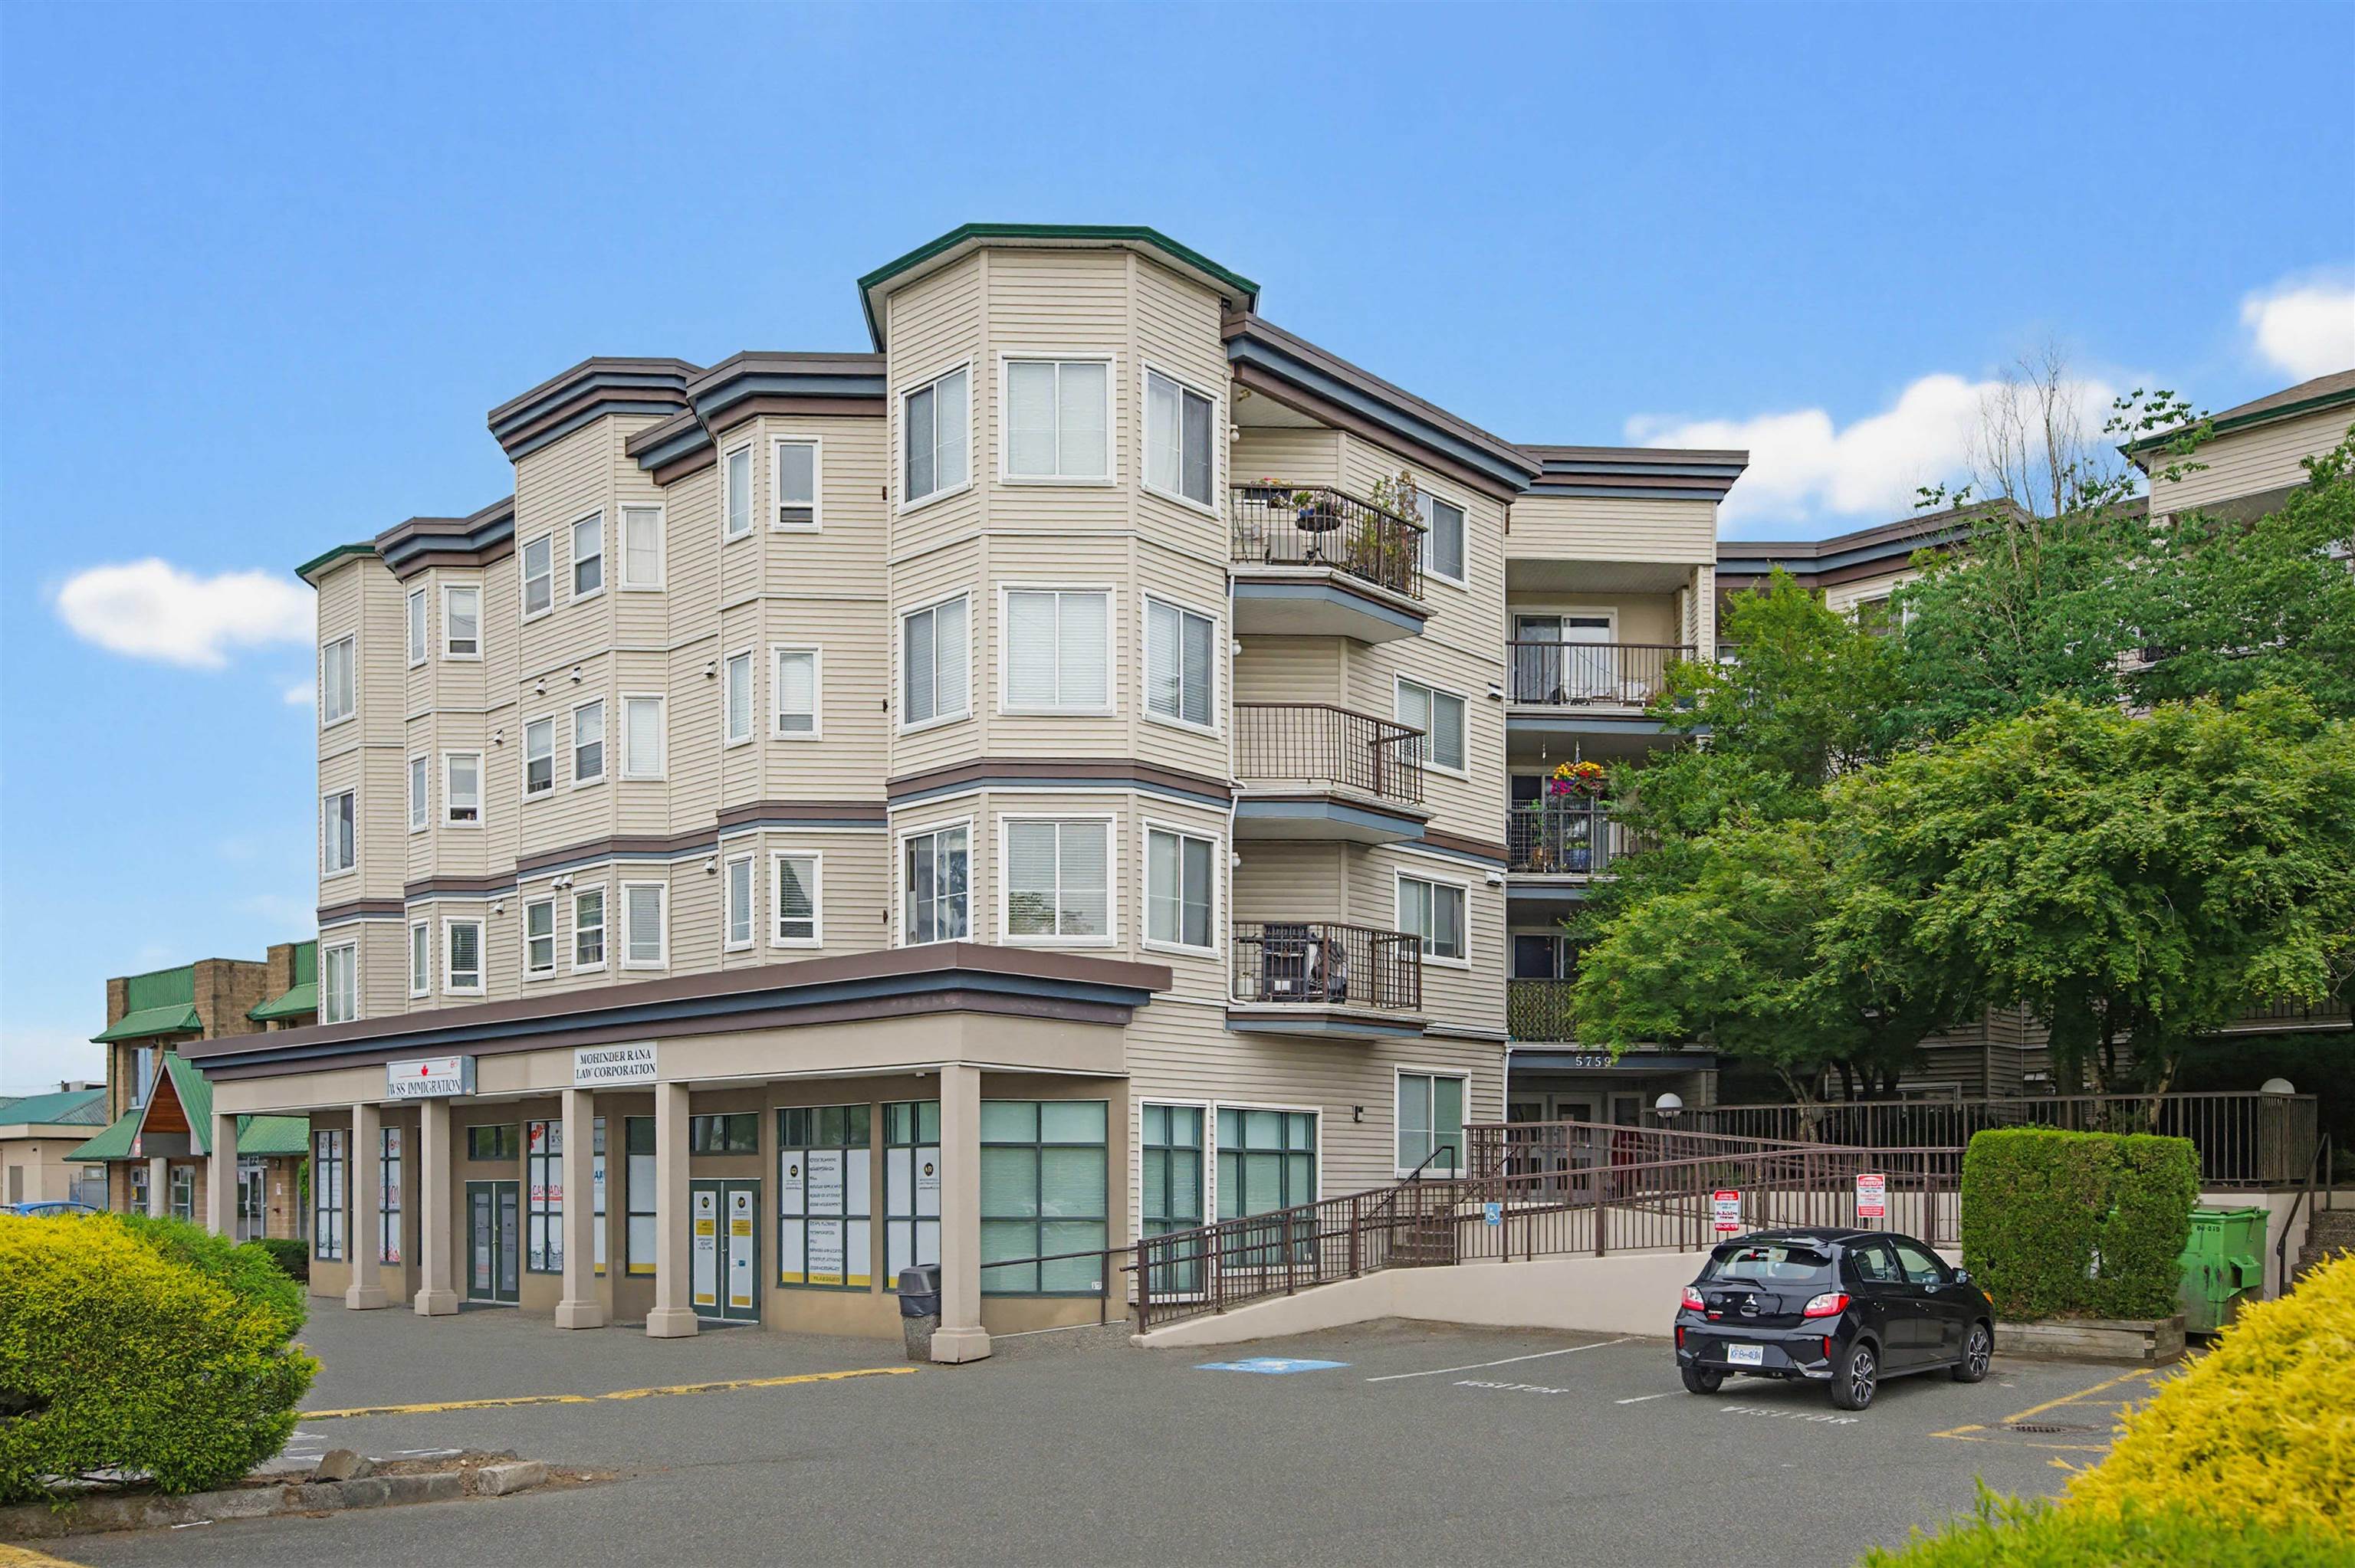
207 5759 Glover Road
Langley City · Condo · MLS® R3163764
$365,000ratio 45% below its group median
A two-bedroom on the second floor of College Court, 853 square feet, built 1996, asking $365,000 and paying $3,061 a year: 119 dollars of asking price per dollar of tax. Among the 136 Langley City condos with a current tax bill read on 6 October the median is 217, so this ratio is 45% below its group’s. At $428 a foot it is also 20% under the $534 median for the 157 Langley City condos listed. It is the widest gap on this screen among the listings that passed this month’s exclusions.
Property tax $3,061 a year (2026 sheet) · group of 136 Langley City condos with a current tax bill (157 listed), median ratio 217, read 6 October 2026
 02
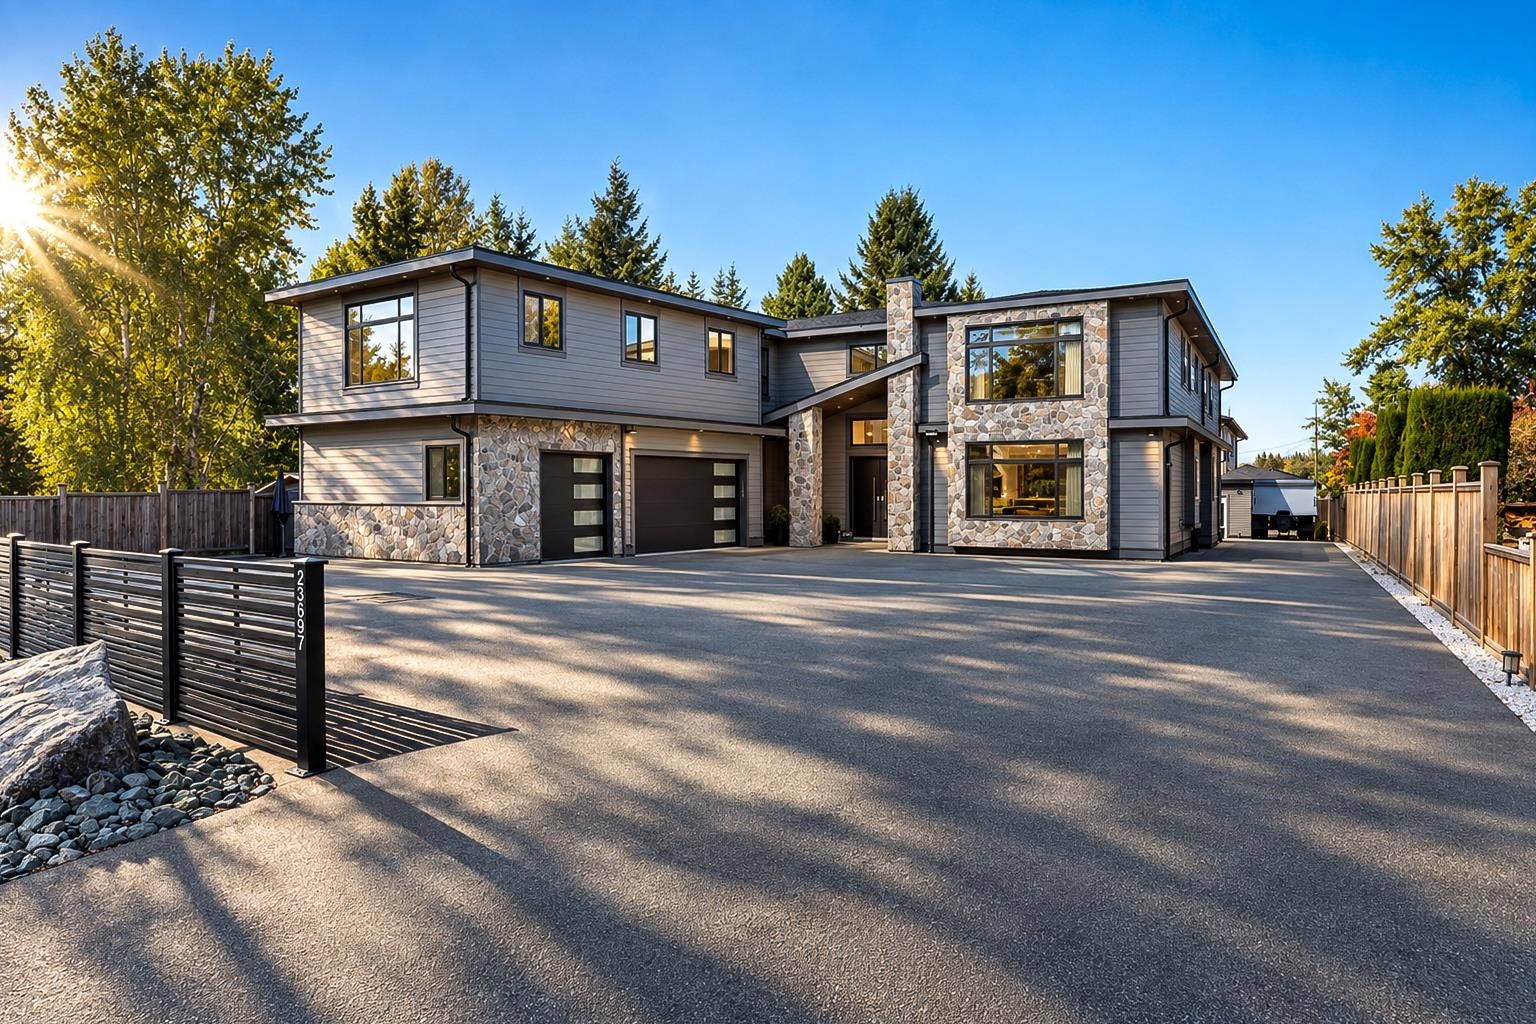
23697 Old Yale Road
Campbell Valley · House · MLS® R3170676
$2,799,900ratio 28% below its group median
7,749 square feet built in 2019, eleven bedrooms and nine bathrooms across the main house and two suites, on a 16,509-square-foot lot, asking $2,799,900 and paying $13,956 a year: a ratio of 201 where the median for the 14 Campbell Valley houses on under an acre with a current bill is 280, which is 28% below. At $361 a foot it is also 37% under the $575 median for the 15 Campbell Valley houses listed on under an acre. Of the 51 Campbell Valley houses listed, 14 are in this comparison; the others are on an acre or more or show no current bill.
Property tax $13,956 a year (2026 sheet) · group of 14 Campbell Valley houses on under an acre with a current tax bill (51 houses listed), median ratio 280, read 6 October 2026
 03
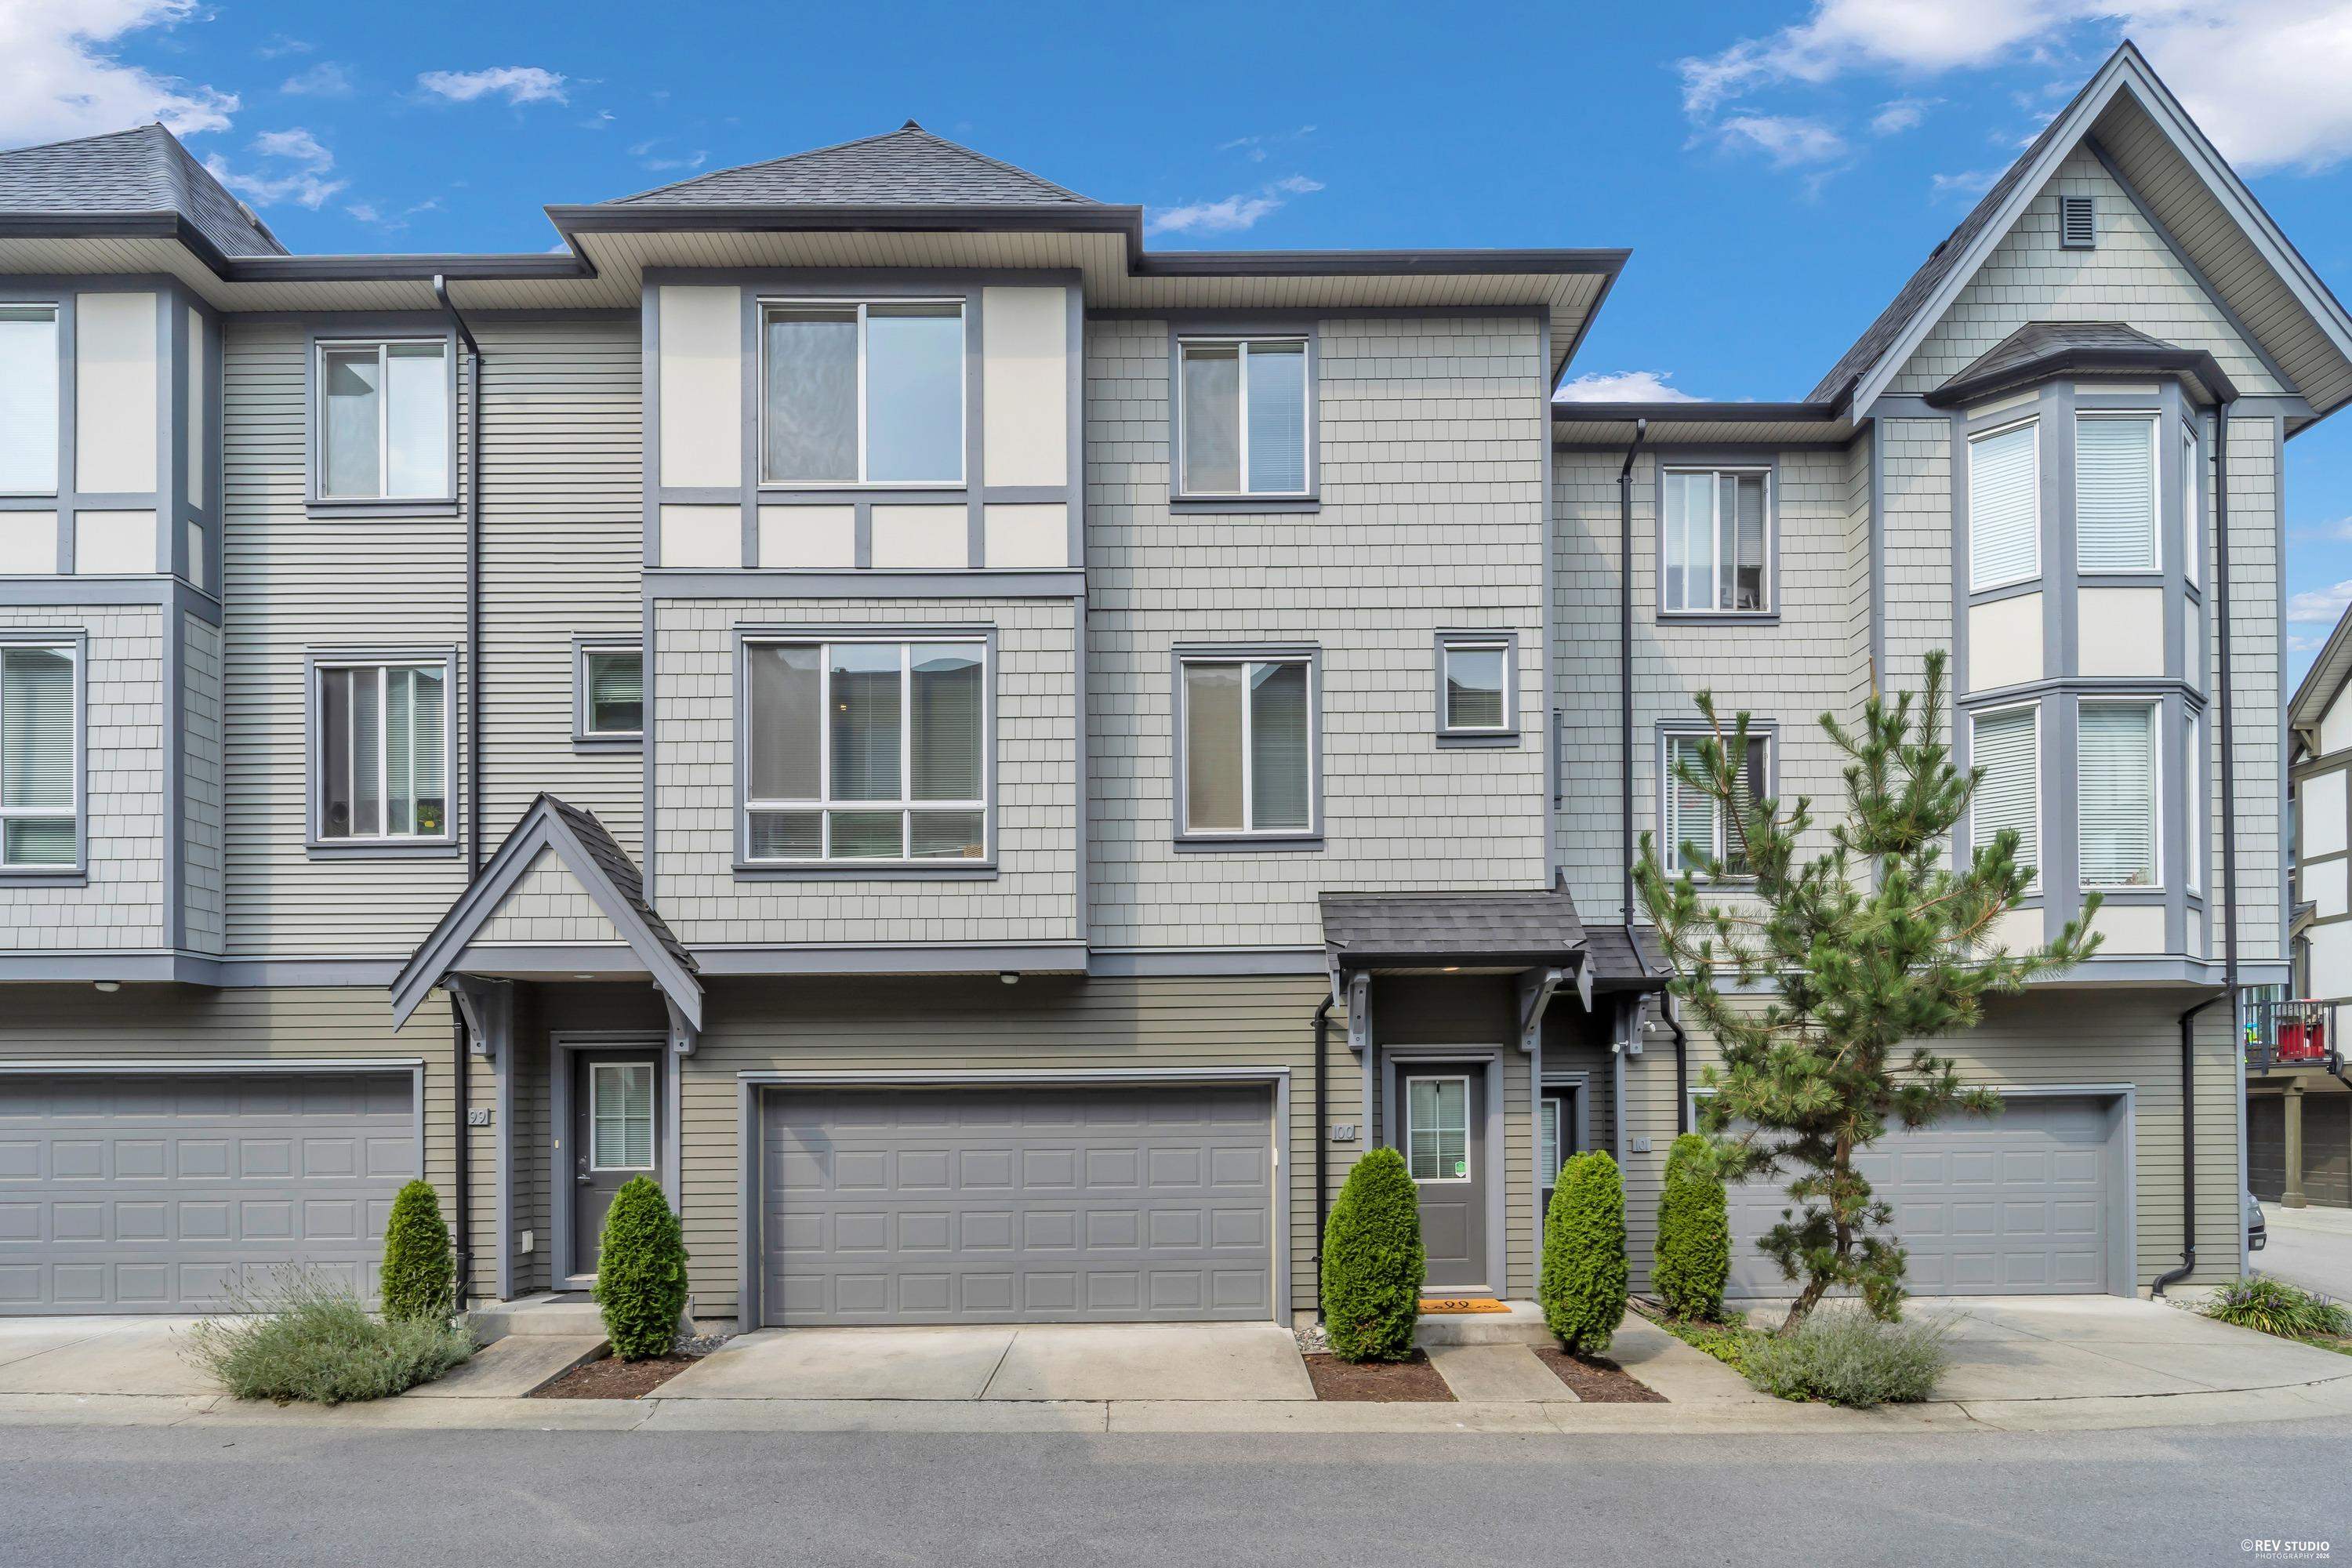
100 8138 204 Street
Willoughby Heights · Townhouse · MLS® R3156215
$799,900ratio 26% below its group median
A 2017 townhouse at Ashbury + Oak with two bedrooms and three bathrooms, 1,356 square feet and a walkout yard off the main floor, asking $799,900 and paying $4,020 a year. The median for the 113 Willoughby Heights townhouses with a current bill is 270 dollars of price per dollar of tax; this one is at 199, which is 26% below. The square-foot test does not agree: at $590 a foot it is 6% over the $557 median for the 156 Willoughby Heights townhouses listed, so only the tax screen fires here.
Property tax $4,020 a year (2025 sheet) · group of 113 Willoughby Heights townhouses with a current tax bill (156 listed), median ratio 270, read 6 October 2026
 04
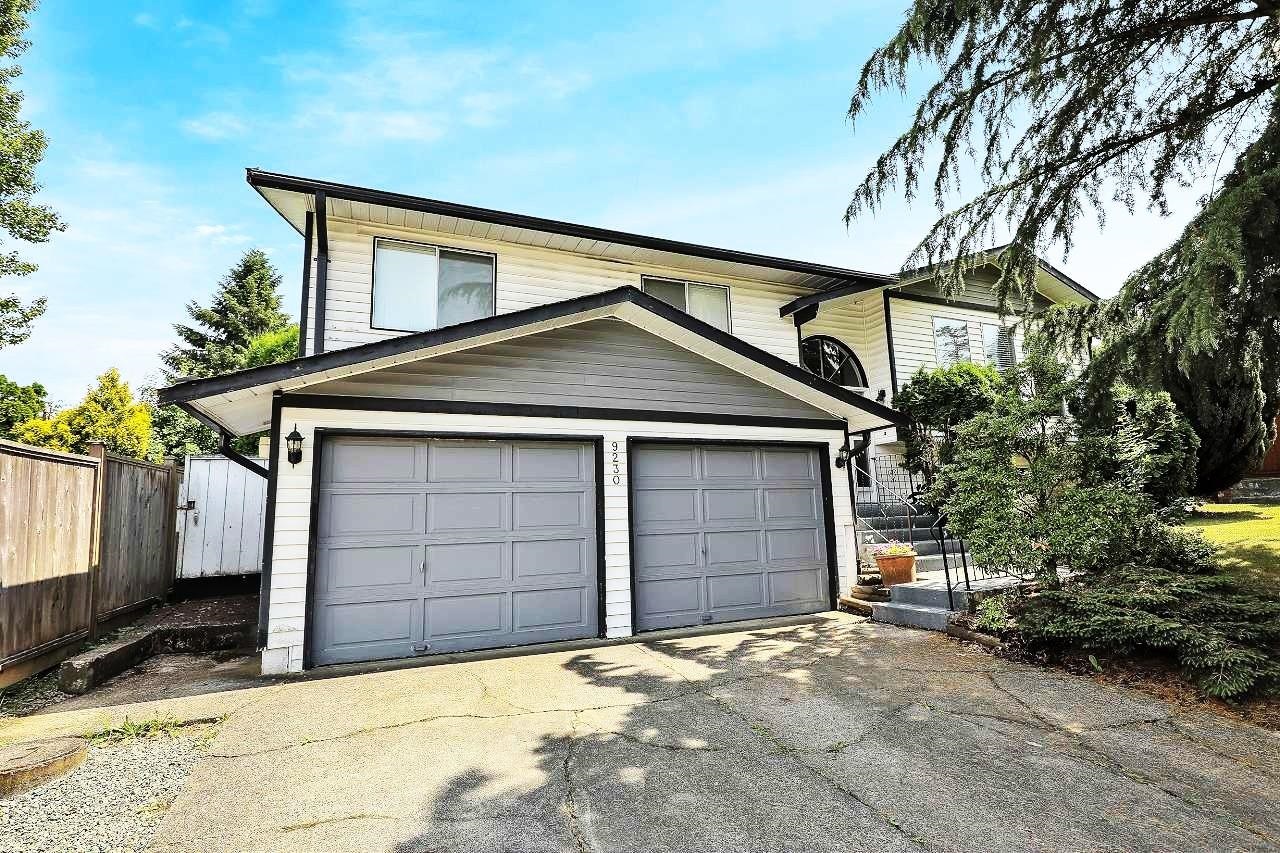
9230 212B Street
Walnut Grove · House · MLS® R3160446
$1,049,900ratio 24% below its group median
Here for a second month, because it passed again on a fresh read. A 1983 four-bedroom of 2,136 square feet on a cul-de-sac, asking $1,049,900 and paying $4,821 a year: a ratio of 218 where the median for the 36 Walnut Grove houses in the group is 285, which is 24% below. At $492 a foot it is 16% under the $583 median for the 38 Walnut Grove houses listed on under an acre. The listing says it was last updated about twenty years ago and has suite potential through the garage.
Property tax $4,821 a year (2026 sheet) · group of 36 Walnut Grove houses on under an acre with a current tax bill (40 houses listed), median ratio 285, read 6 October 2026
 05
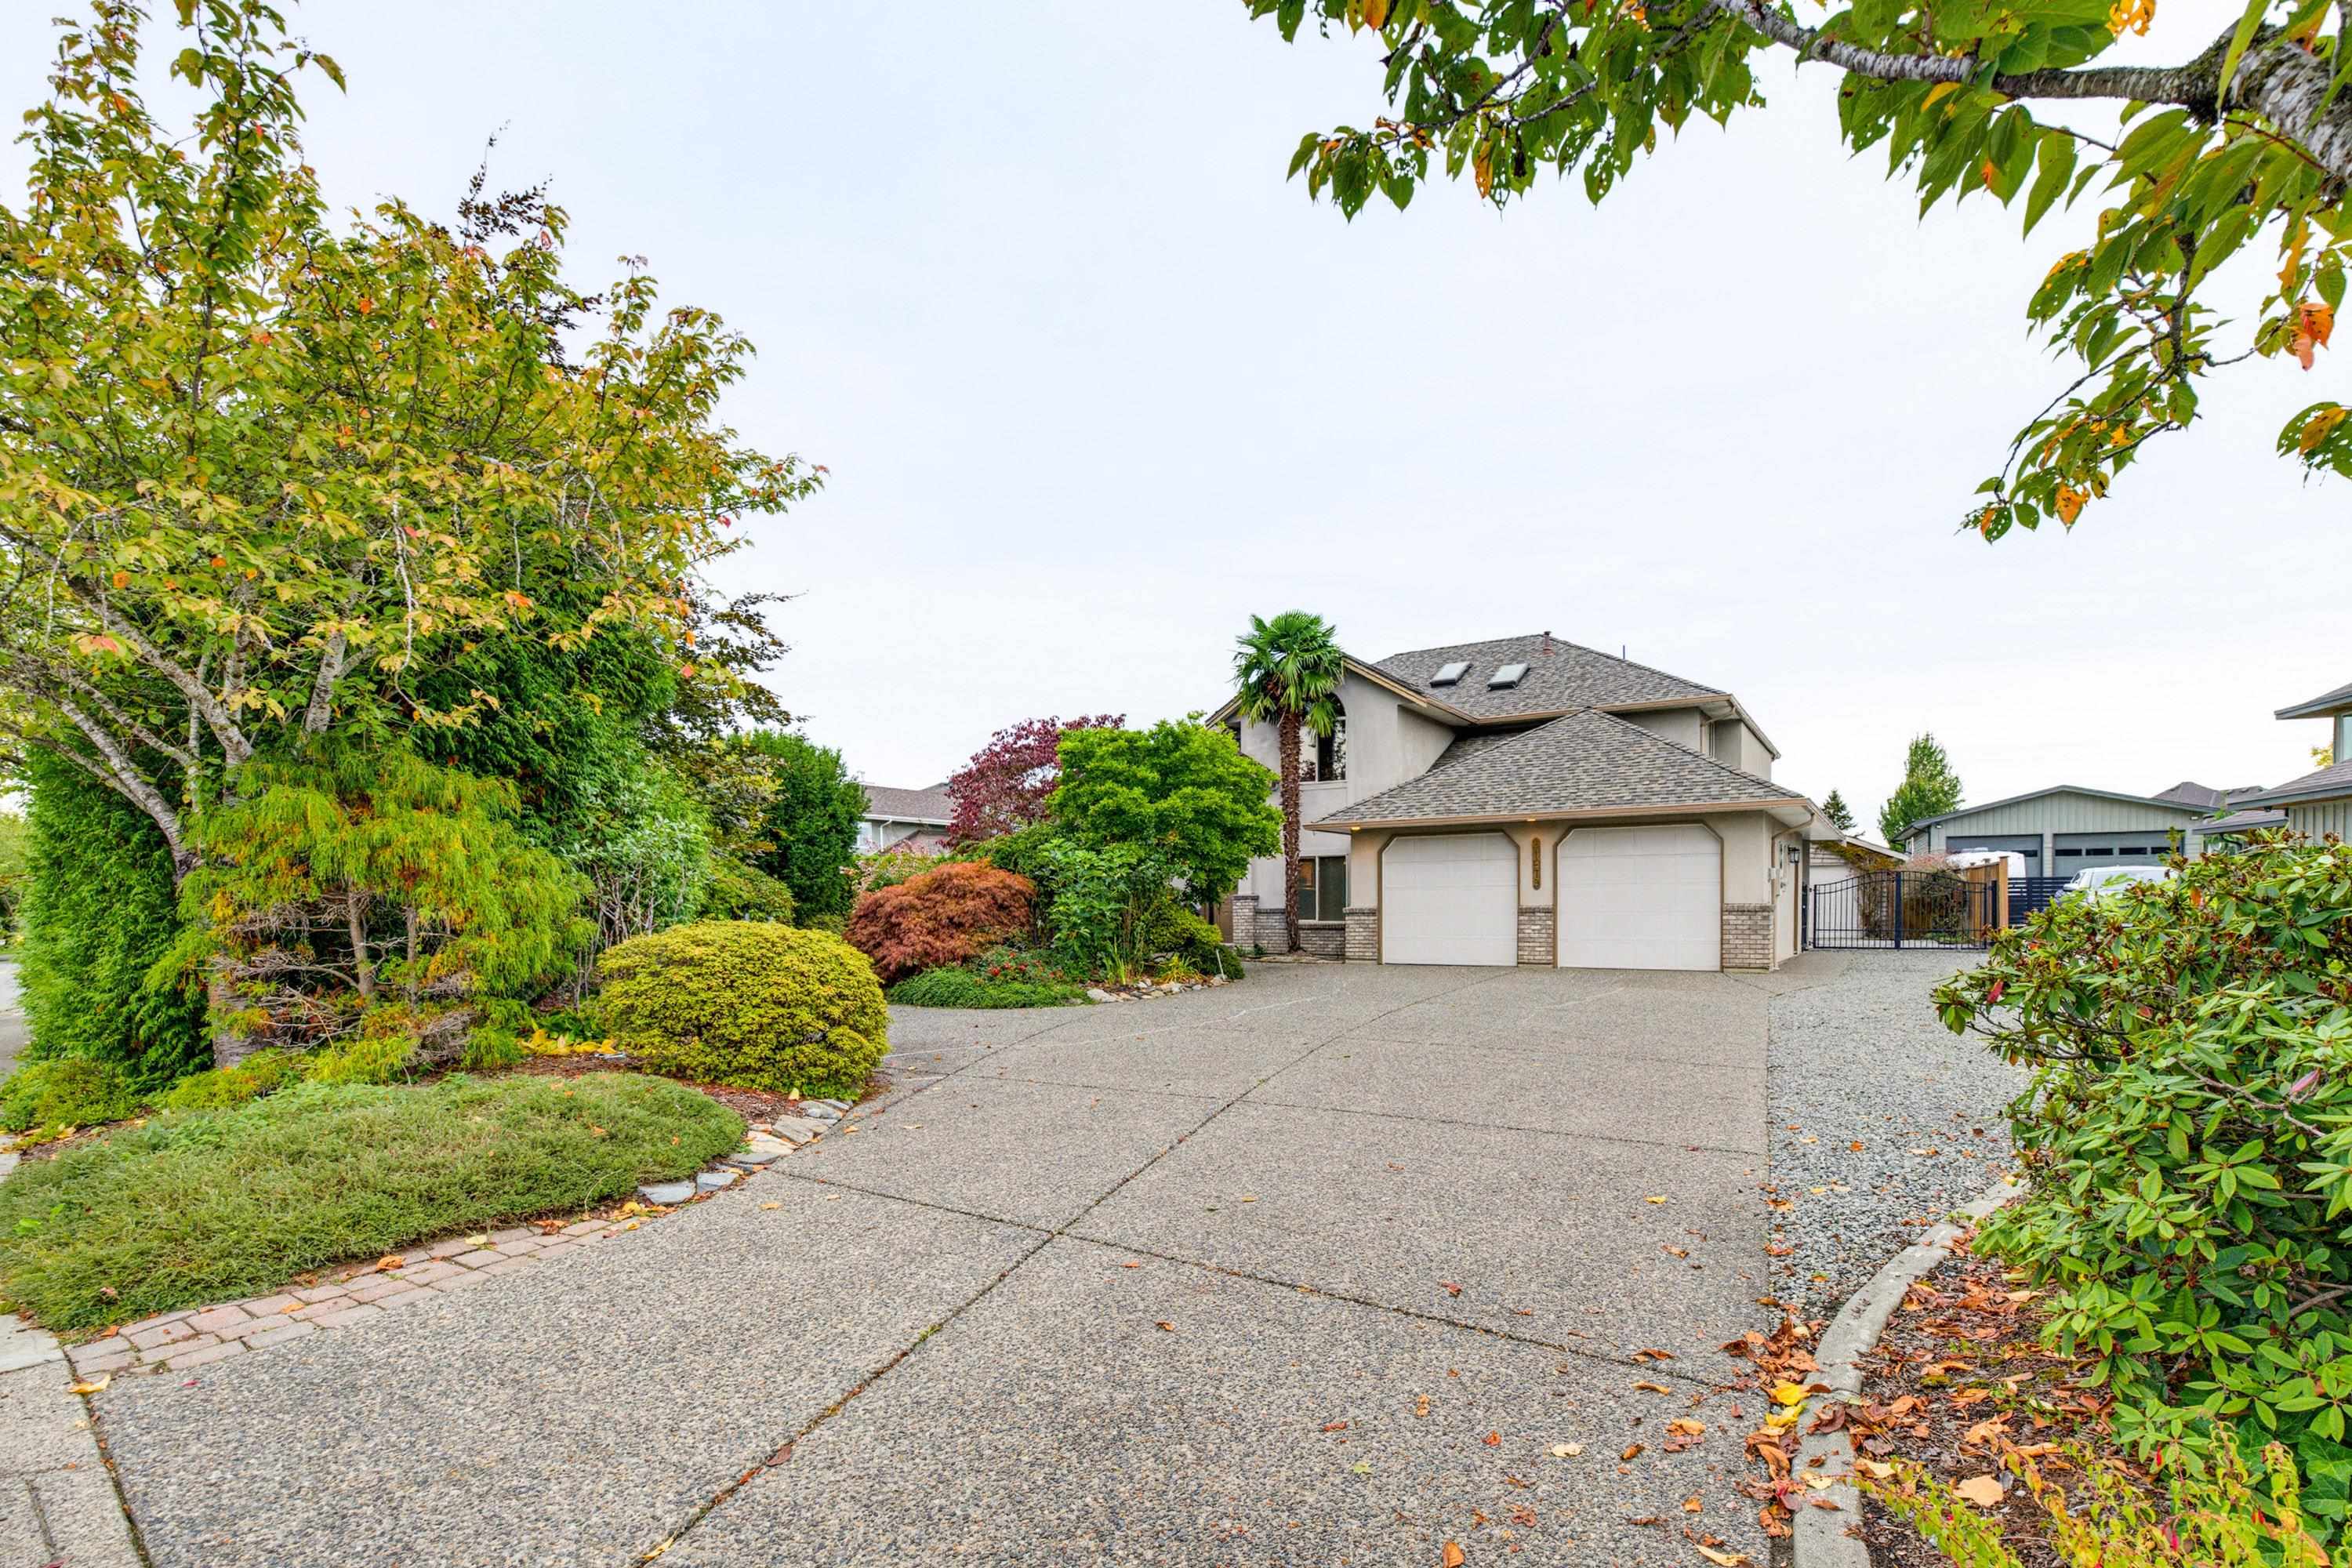
21679 52 Avenue
Murrayville · House · MLS® R3171682
$1,748,000ratio 24% below its group median
A 1997 two-storey of 3,254 square feet with five bedrooms on a 22,085-square-foot lot, about half an acre, with a detached garage and workshop. Asking $1,748,000 and paying $7,953 a year, a ratio of 220 against a median of 288 for the 31 Murrayville houses in the group, which is 24% below. By the square foot it is $537, 4% under the $559 median for the 31 Murrayville houses listed on under an acre, so this one is here on the tax screen alone.
Property tax $7,953 a year (2026 sheet) · group of 31 Murrayville houses on under an acre with a current tax bill (35 houses listed), median ratio 288, read 6 October 2026
Two · Space For The Money
Where the numbers quietly work.
Nothing dramatic in these, which is rather the point. Each asks well under the median dollars per square foot for its own type in its own neighbourhood. A large home can ask fewer dollars per square foot simply because it is large, so this is a broad screen of where to look and not a finding that any of them is a bargain.
How these five were chosen
The test.
Asking price divided by finished floor area, compared against the median dollars per square foot
for the same dwelling
type in the same neighbourhood. Houses on an acre or more are left out of that median as well as out of the picks, so a house on a lot is measured against houses on lots. Ranked by how far under that median they sit, from
45% to 38%.
Why it is a separate test.
The tax measure and the square-foot measure can disagree, and when they do it is usually telling you
something. A home can be priced fairly against its tax and still be unusually large for the money,
or the reverse. Running both independently and showing you which one fired is more honest than
blending them into one score you cannot check.
The guard.
Anything above 1.4 times its neighbourhood’s median dollars per square foot is dropped, which
removes land plays priced for what can be built rather than what stands there. One listing per
neighbourhood and type, so five picks means five different corners of Langley. Since October 2026, new construction with no tax bill yet, age-restricted buildings and lots of an acre or more are left off this test as well.
 06
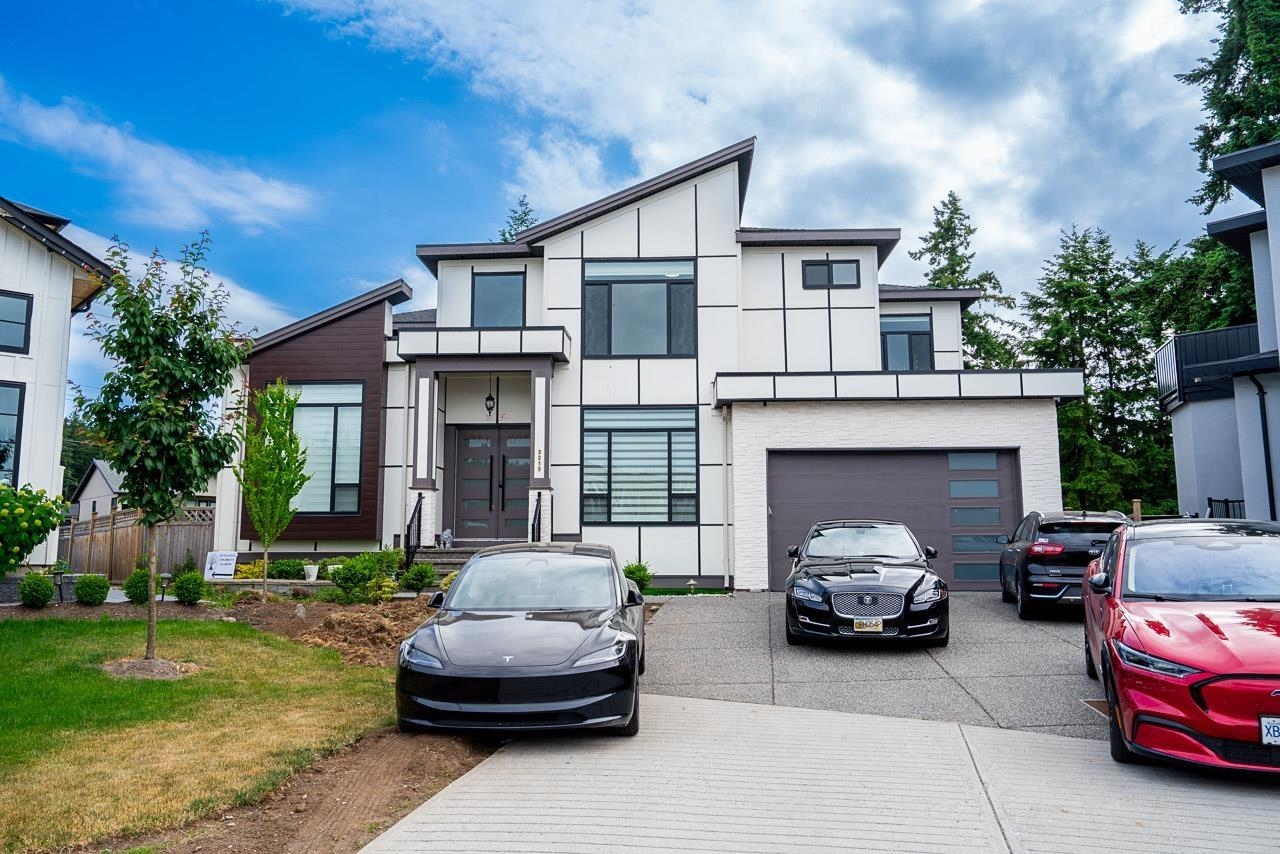
3215 197 Street
Brookswood · House · MLS® R3156665
$2,049,000$305/sq ft · 45% under
Here for a second month and $100,000 lower: $2,049,000 against $2,149,000 in September. 6,715 square feet, built 2021, at $305 a foot against a $551 median for the 97 Brookswood houses listed on under an acre. The listing describes it as a foreclosure, which keeps it off the tax screen; its price-to-tax ratio is 26% below its group’s median.
Property tax $9,914 a year
 07
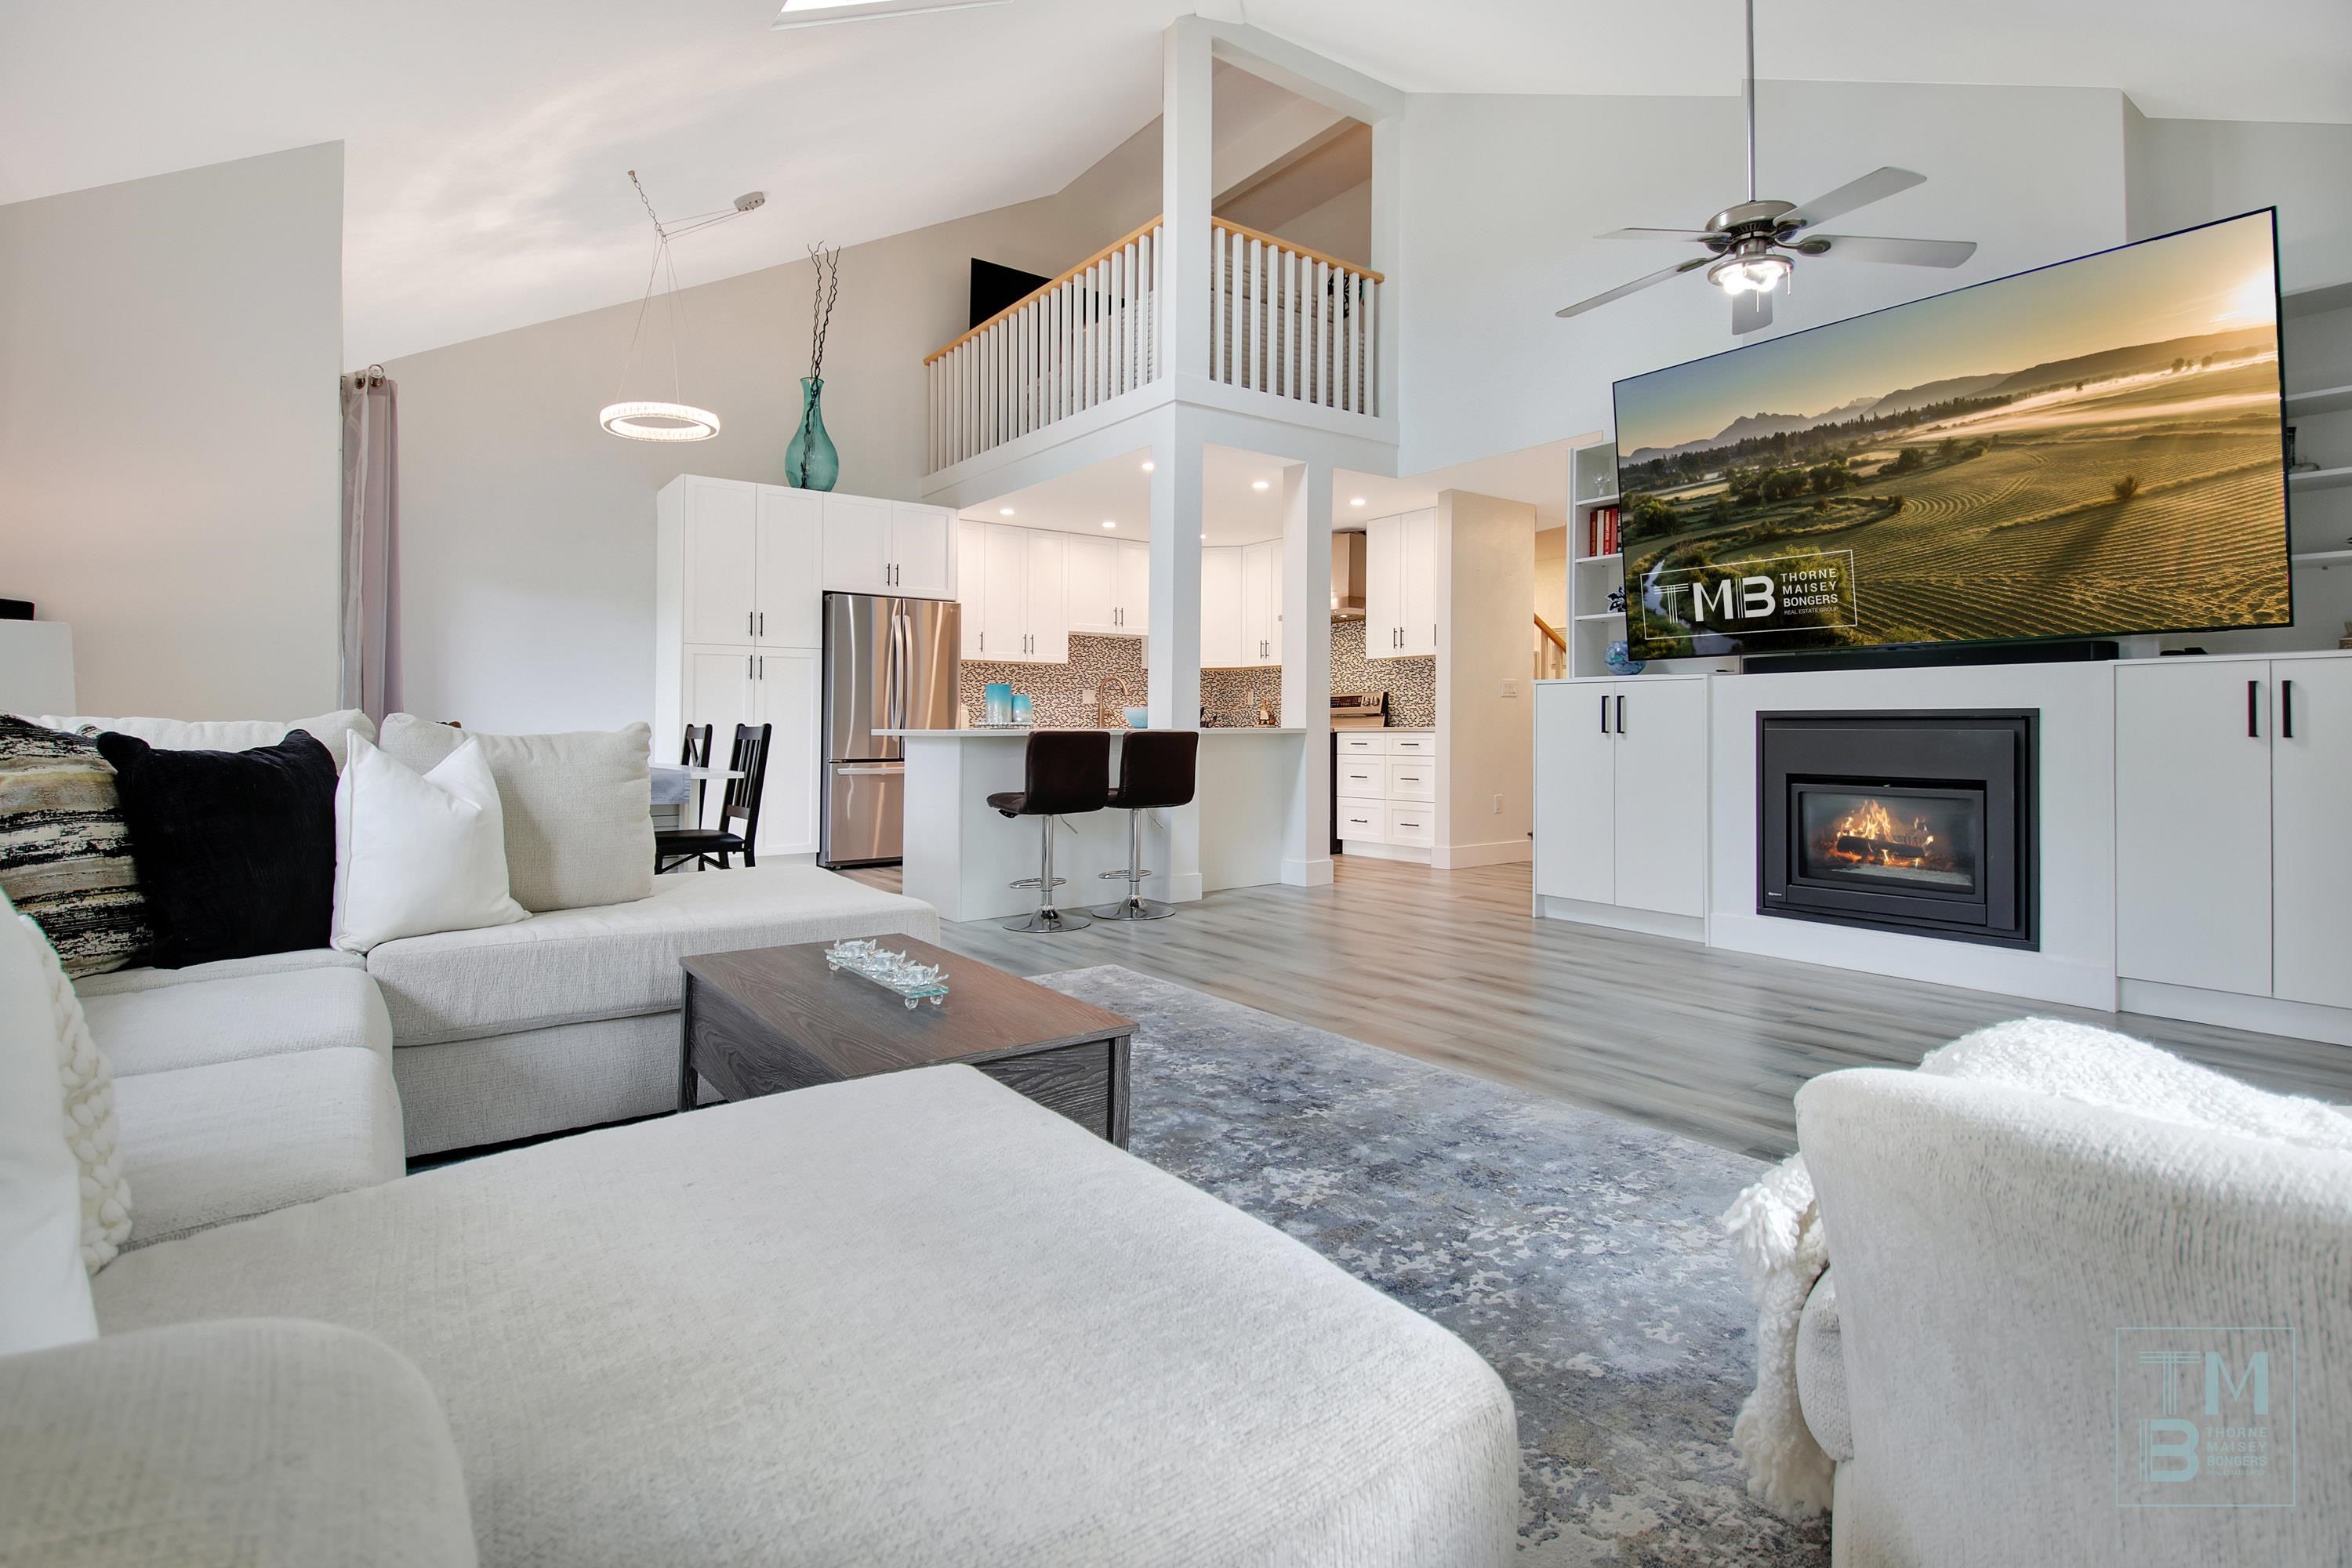
213 19721 64 Avenue
Willoughby Heights · Condo · MLS® R3144119
$729,990$384/sq ft · 43% under
The two tests disagree on this one, and both are shown. A two-storey top-floor corner unit at Westside Estates, 1,902 square feet with three bedrooms, two bathrooms and a loft, built 1990, the largest in its building according to the listing. $384 a foot against a $678 median for the 198 Willoughby Heights condos listed. On price to tax it reads the other way: 335 dollars of price per dollar of tax against a group median of 272, which is 23% over.
Property tax $2,177 a year
 08
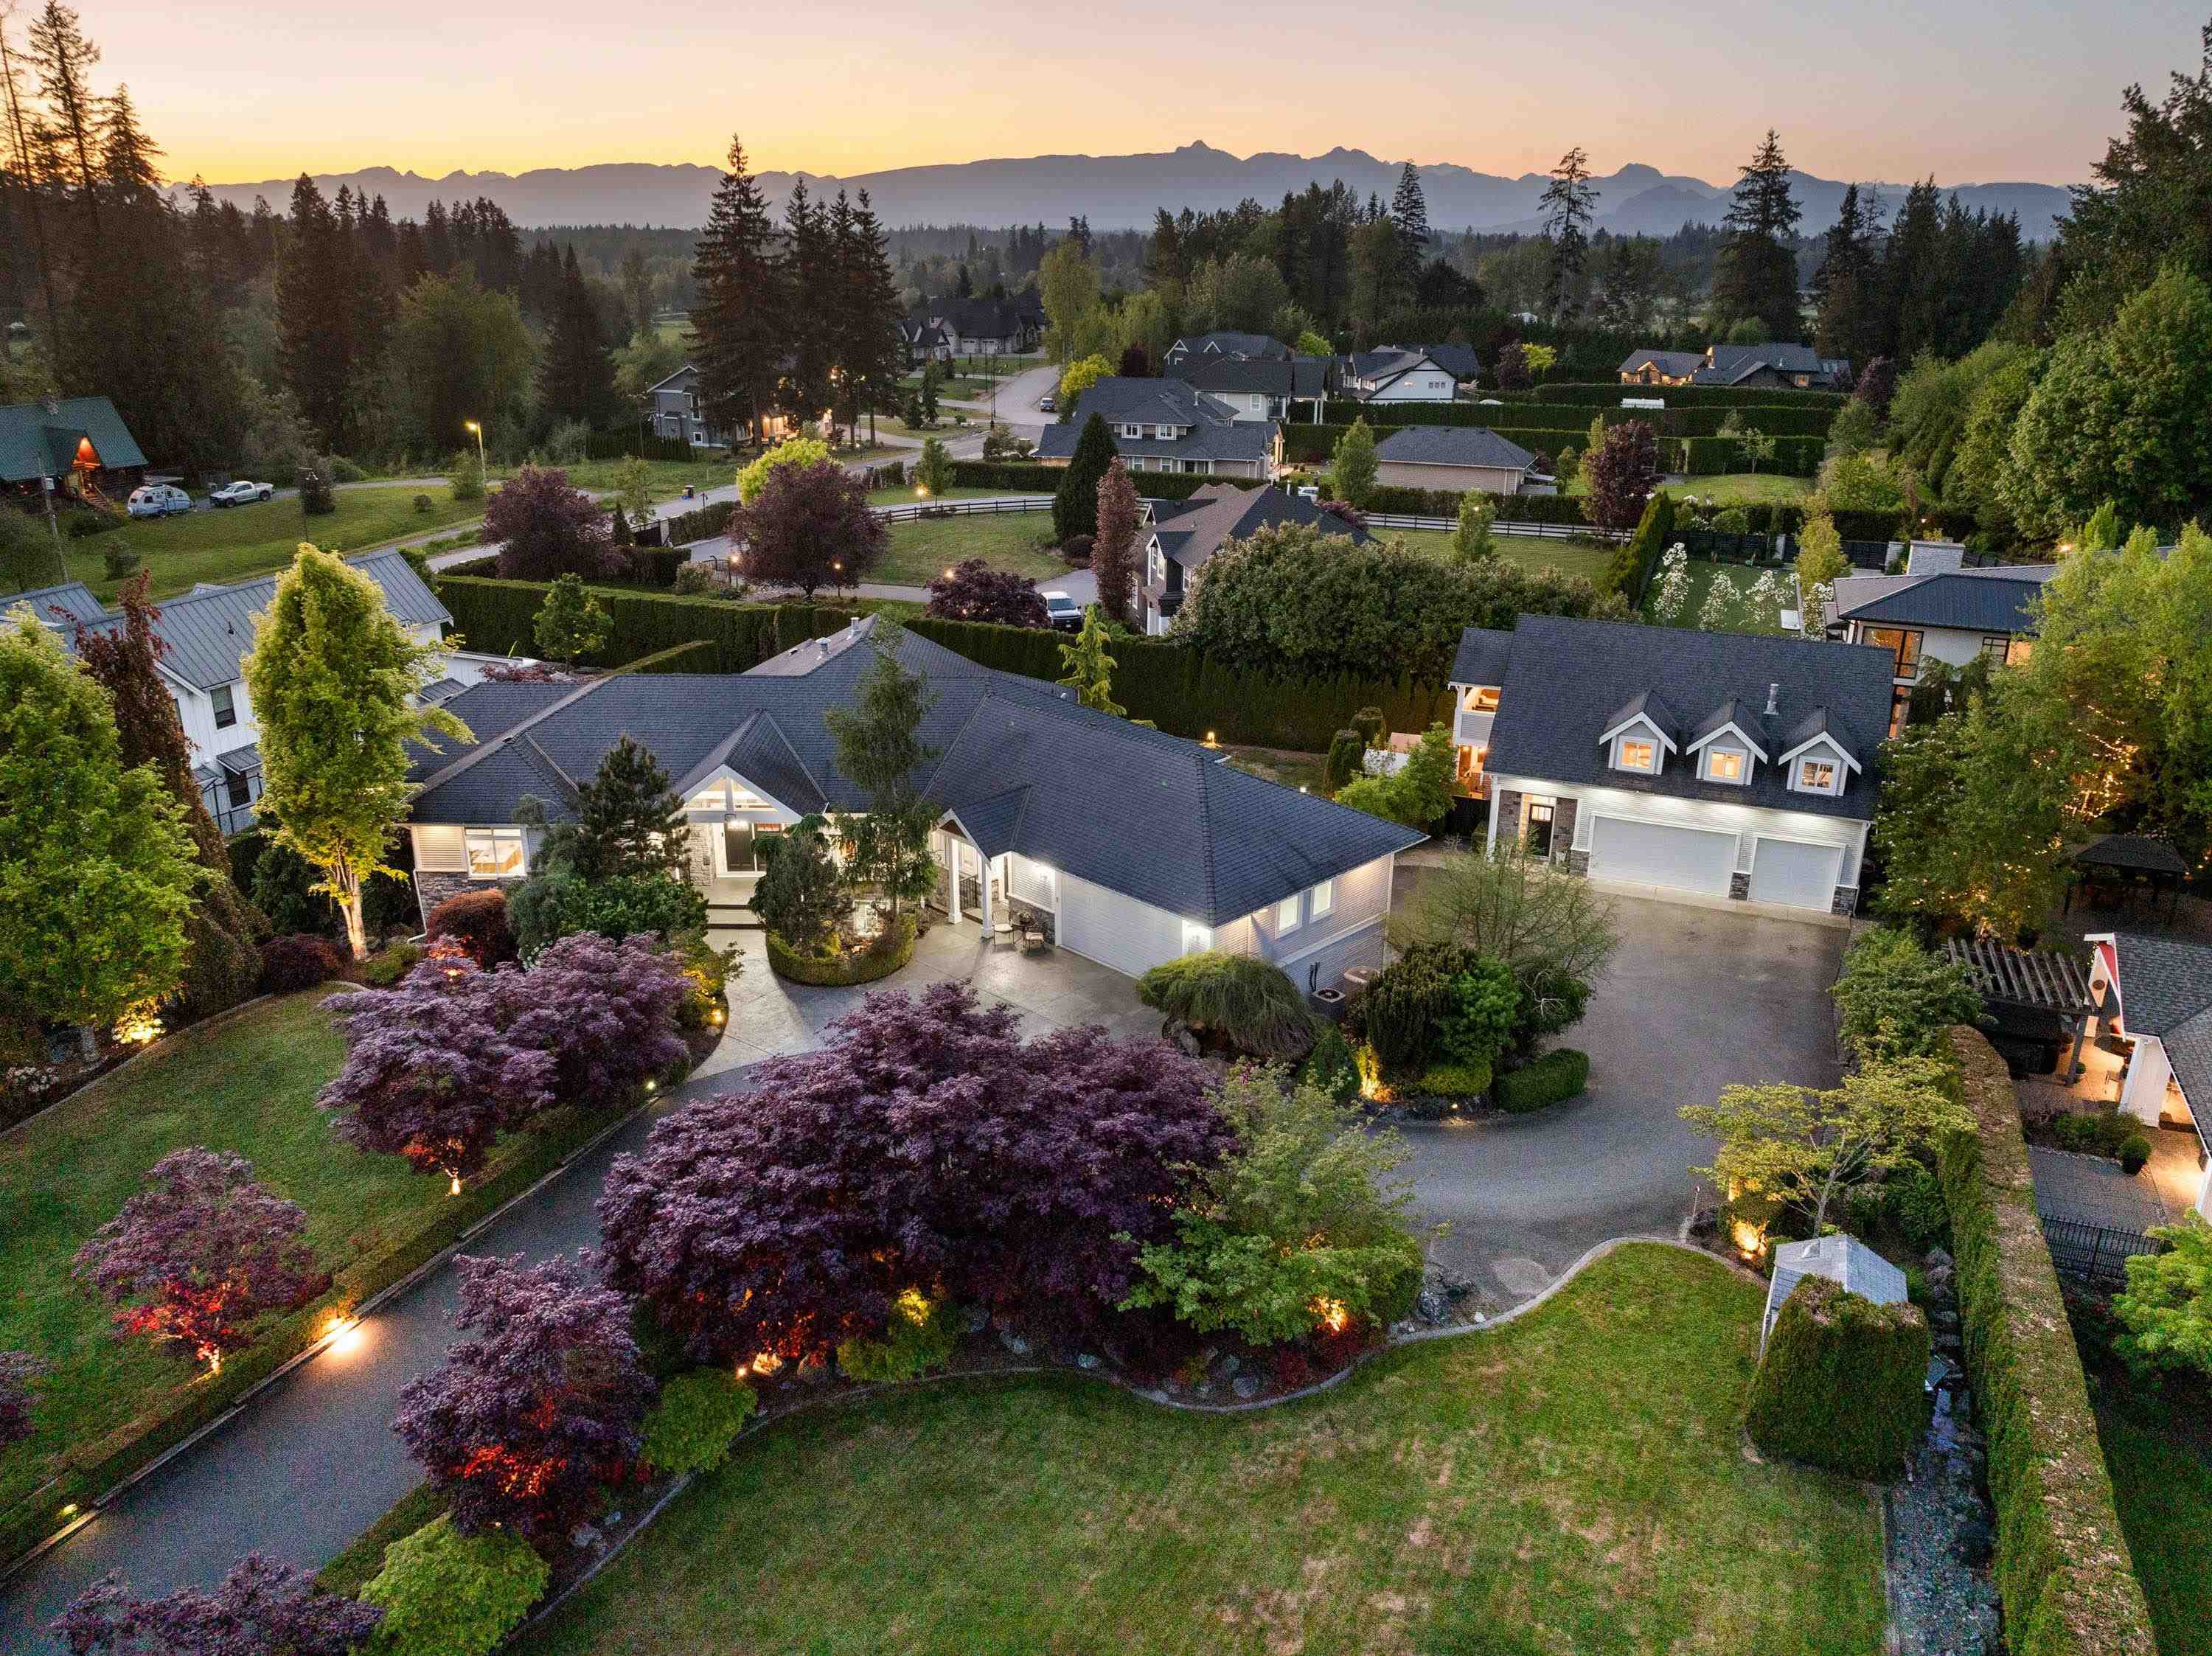
23107 80 Avenue
Fort Langley · House · MLS® R3172807
$2,899,000$390/sq ft · 43% under
7,434 square feet on 39,639 square feet of land, just under an acre, built 2007: a rancher with a walkout four-bedroom suite below and a separate coach home, nine bedrooms and eight bathrooms in all. $390 a foot against a $688 median for the 23 Fort Langley houses listed on under an acre. The tax screen does not fire here (its ratio is 2% above its group’s median), so this is a square-foot pick only.
Property tax $10,000 a year
 09
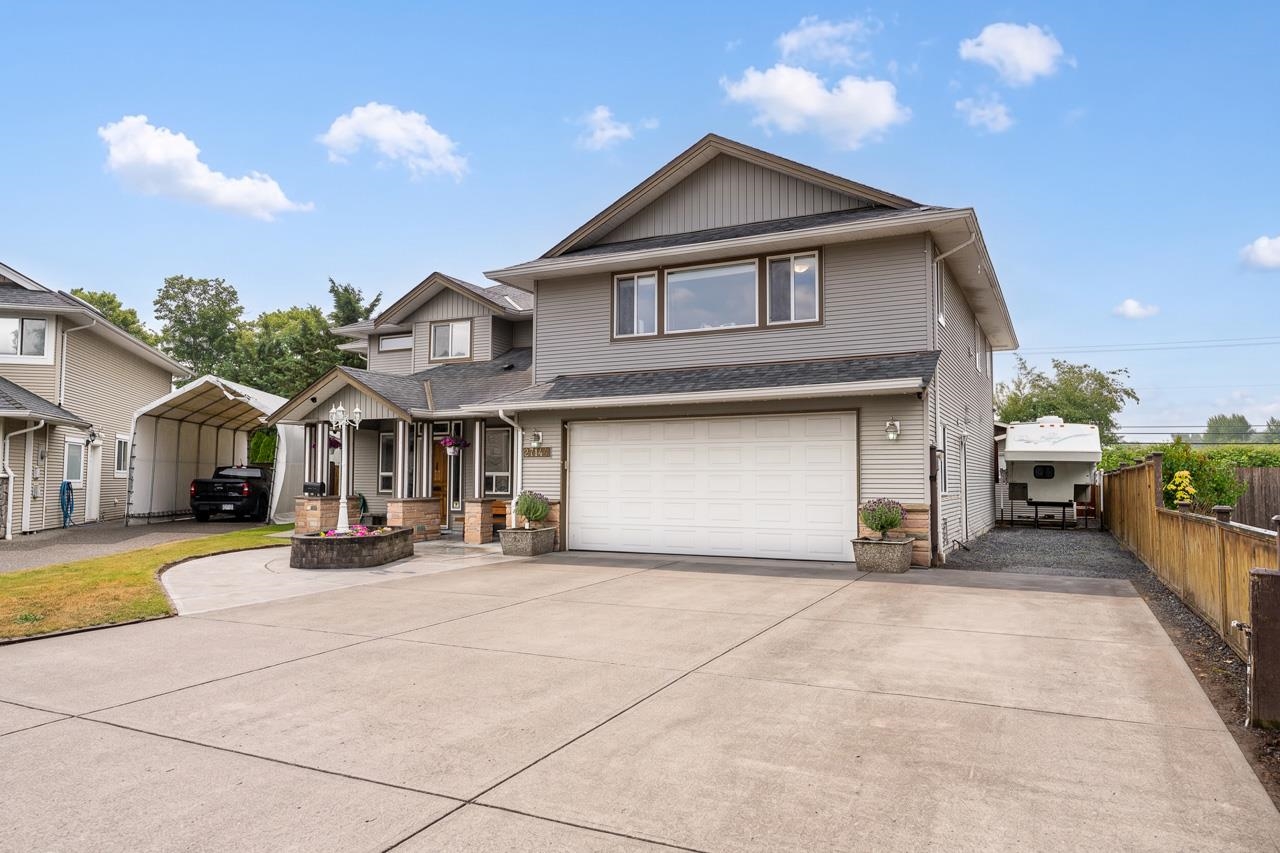
27144 25A Avenue
Aldergrove · House · MLS® R3169334
$1,433,000$323/sq ft · 38% under
A 2004 two-level house of 4,442 square feet with eight bedrooms and six bathrooms on an 8,741-square-foot lot, asking $1,433,000. $323 a foot against a $524 median for the 53 Aldergrove houses listed on under an acre. The listing describes it as suited to multi-generational living and handicap accessible, with RV parking. On the tax screen its ratio is 9% below its group’s median, short of that list.
Property tax $5,498 a year
 10
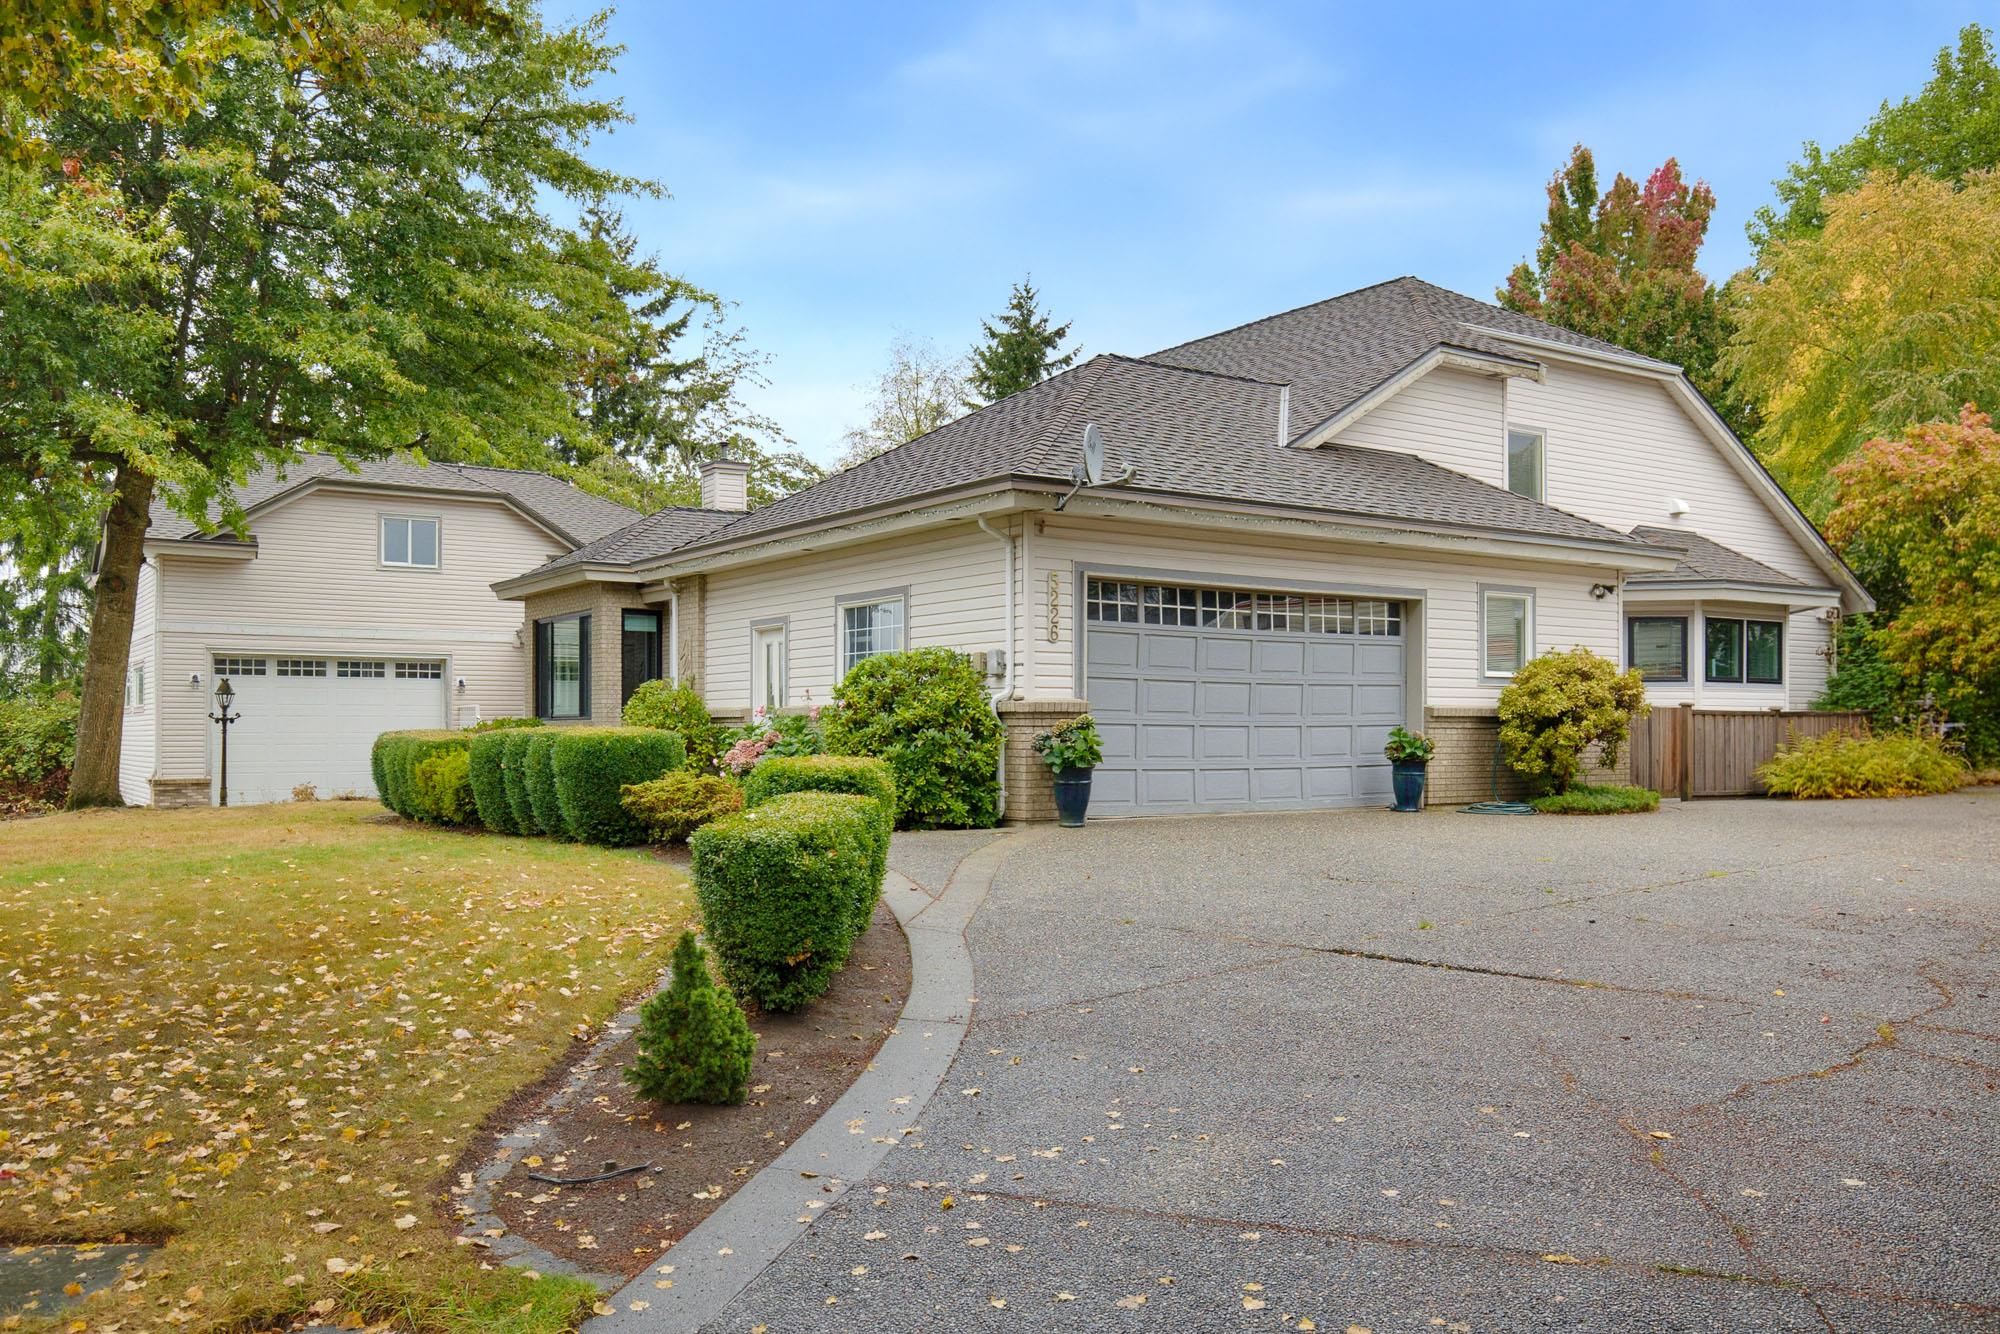
5226 222 Street
Murrayville · House · MLS® R3170918
$2,198,000$346/sq ft · 38% under
A 1993 rancher with a loft and an attached two-bedroom coach house above a triple garage, listed at 6,346 square feet with six bedrooms and six bathrooms on a 21,227-square-foot lot, about half an acre, asking $2,198,000. The listing describes an indoor pool, hot tub and sauna. $346 a foot against a $559 median for the 31 Murrayville houses listed on under an acre. On the tax screen its ratio is level with its group’s median, so this is a square-foot pick only.
Property tax $7,642 a year
Three · The Ones With A Story
Simply worth looking at.
Not chosen on arithmetic. These are the listings that stopped us: land, water, working ground, and houses that were standing before the war. One from each corner of Langley, because a place this varied should not be represented by one street.
How these five were chosen
No arithmetic at all.
These are found by reading, not ranking. We scan every public remark in the municipality for the
things that do not show up in a price: acreage, water on the land, working ground, and a year built
before 1955. Then a person picks.
Why the section exists.
A list chosen only by numbers would be five suburban houses that happen to be cheap. Some of what
is worth seeing in Langley is worth seeing because it is nearly gone: a 1908 house on its original
street, a pre-war farmhouse on land with a creek through it. Those never rank well on dollars per
square foot and they should not have to.
The rule.
One per neighbourhood, so a place this varied is not represented by one street. These are not
claimed to be good value. They are claimed to be worth looking at, which is a different thing and
we say so.
 11
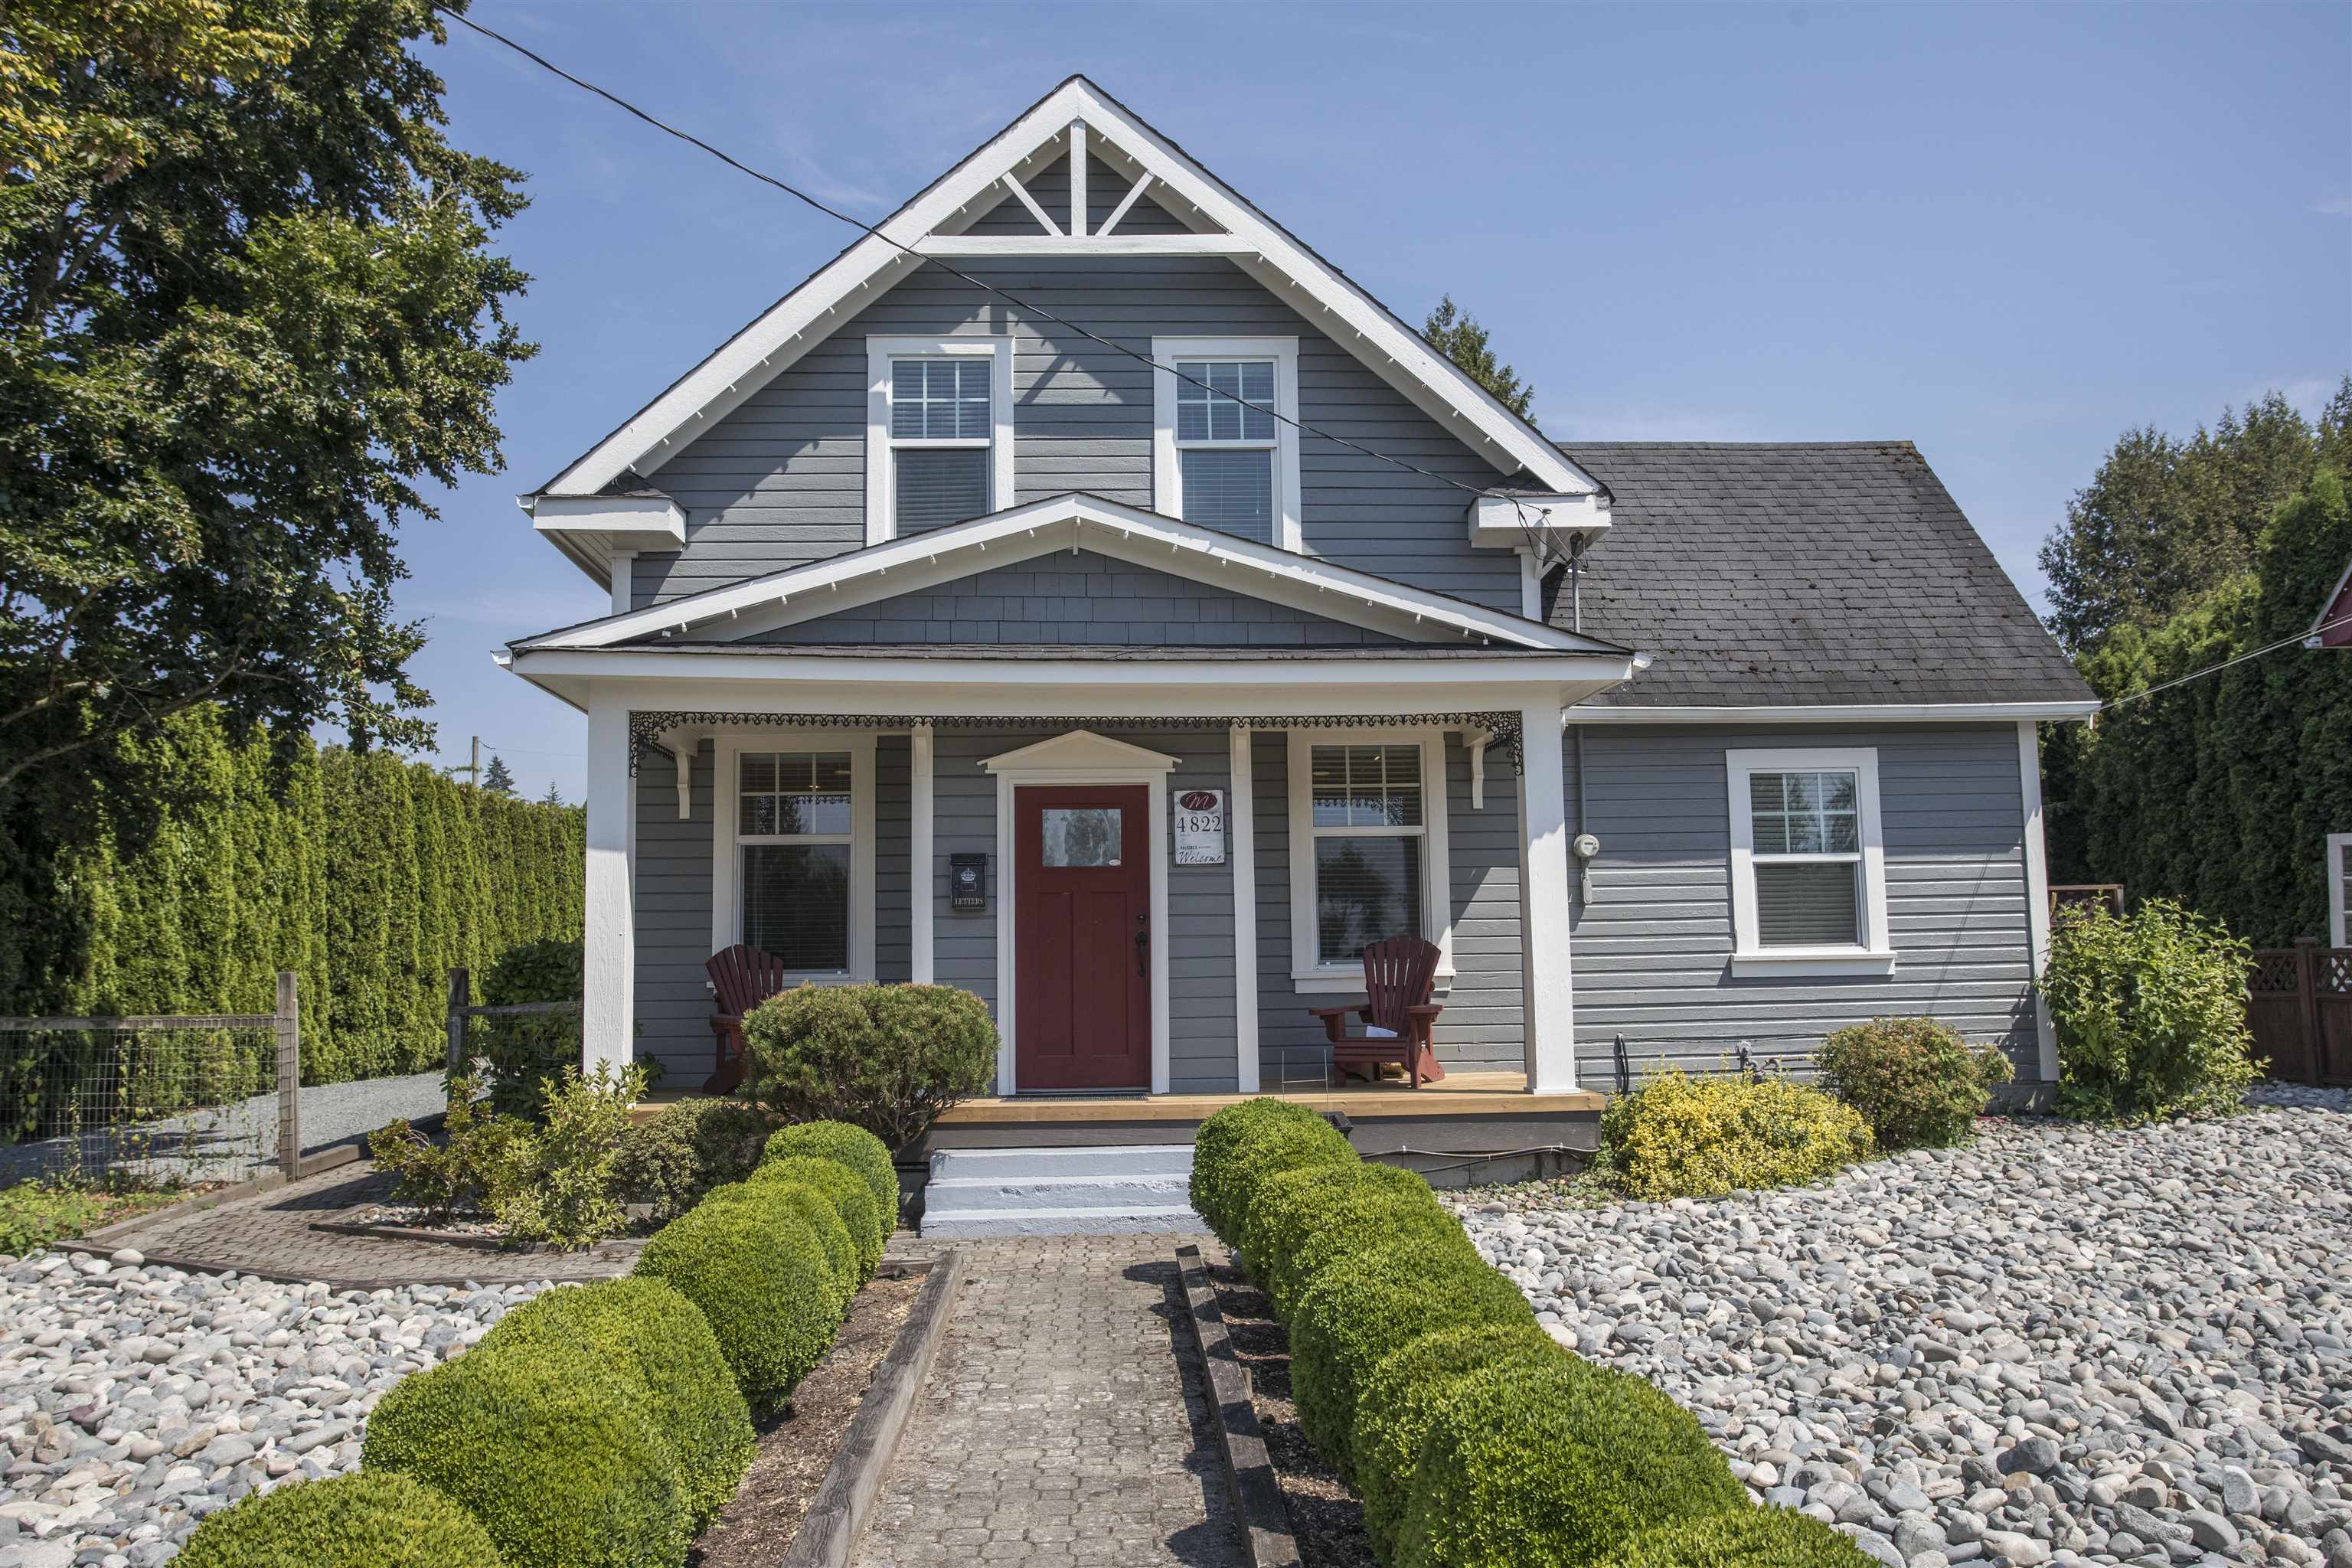
4822 216 Street
Murrayville · House · MLS® R3149729
$1,198,000Built 1908
A hundred and eighteen years old, beside Porter’s Bistro in Murrayville’s Heritage Conservation Area, and $100,000 lower than in September: $1,198,000 against $1,298,000. 1,610 square feet with a main-floor bedroom, lane access and a separate powered workshop. Very little in Langley predates the First World War.
Property tax $4,445 a year
 12
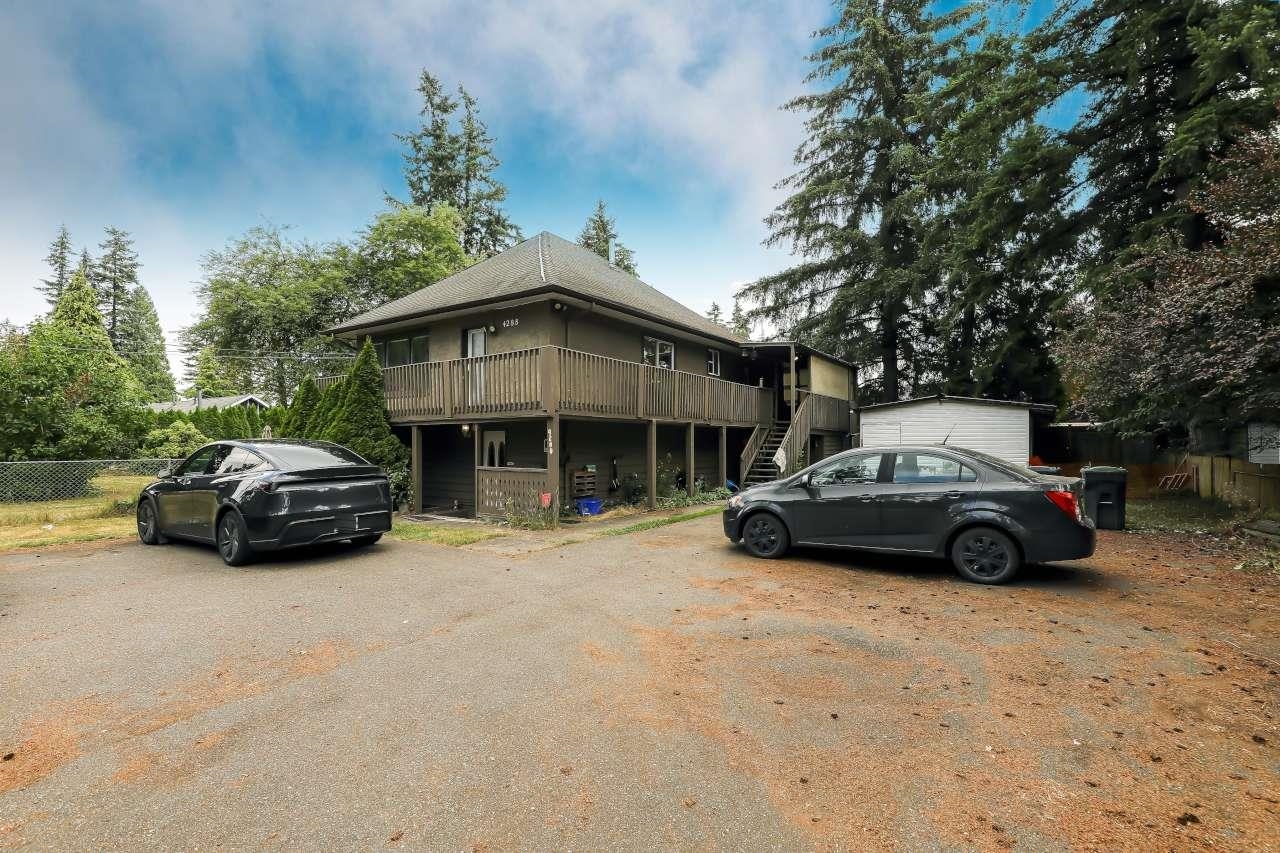
4288 200 Street
Brookswood · House · MLS® R3142072
$1,275,000Built 1922
A 1922 house of 2,085 square feet on 15,312 square feet of Brookswood, with a detached shop. Of the Brookswood houses read this month with a year on the sheet, it is the oldest. The listing presents it as a site to build on or to explore dividing in two, and says the tenants would like to stay.
Property tax $4,219 a year
 13
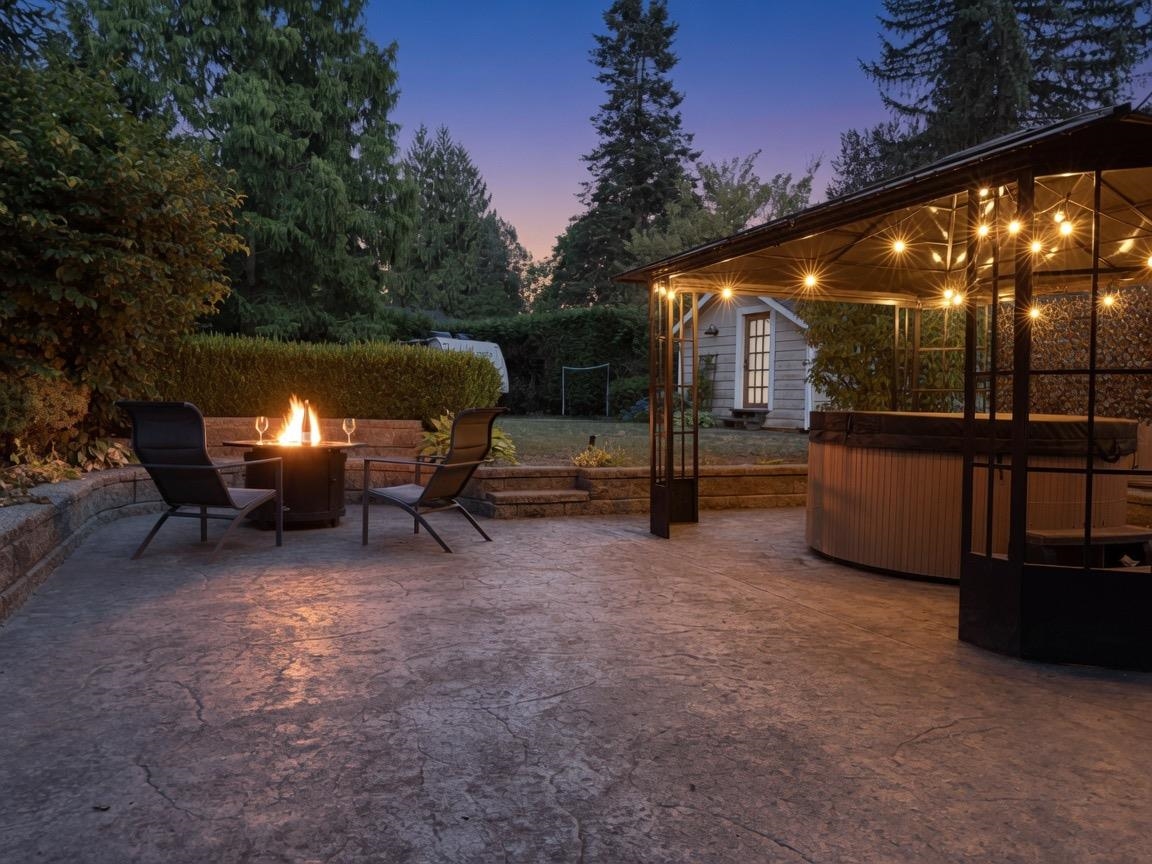
9194 Wright Street
Fort Langley · House · MLS® R3153803
$1,999,900Built 1947
A 1947 house in the village, fully renovated in 2020 according to the listing: 2,808 square feet, four bedrooms with the primary on the main floor, on a 17,600-square-foot lot with a fish pond and a 1,200-square-foot patio. The listing puts the schools, the parks and the riverfront trails within a walk.
Property tax $7,859 a year
 14
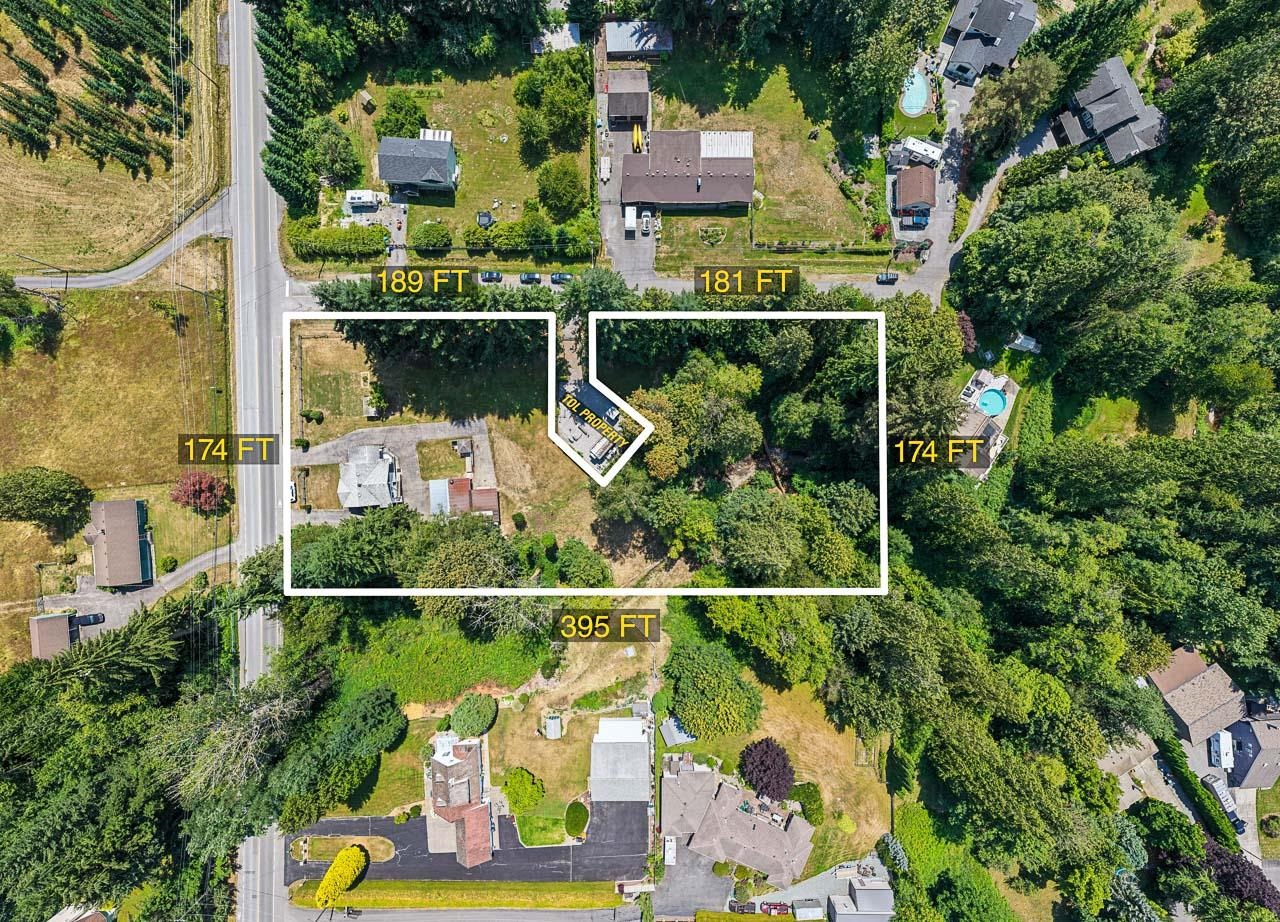
4821 248 Street
Salmon River · House · MLS® R3160837
$1,388,0001.52 acres · 1953
On the market for the first time in more than sixty years: the listing says the same family has kept it since 1963. A 1953 house of 1,771 square feet with three bedrooms on a 1.52-acre corner lot, with a 1,200-square-foot workshop.
Property tax $5,656 a year
 15
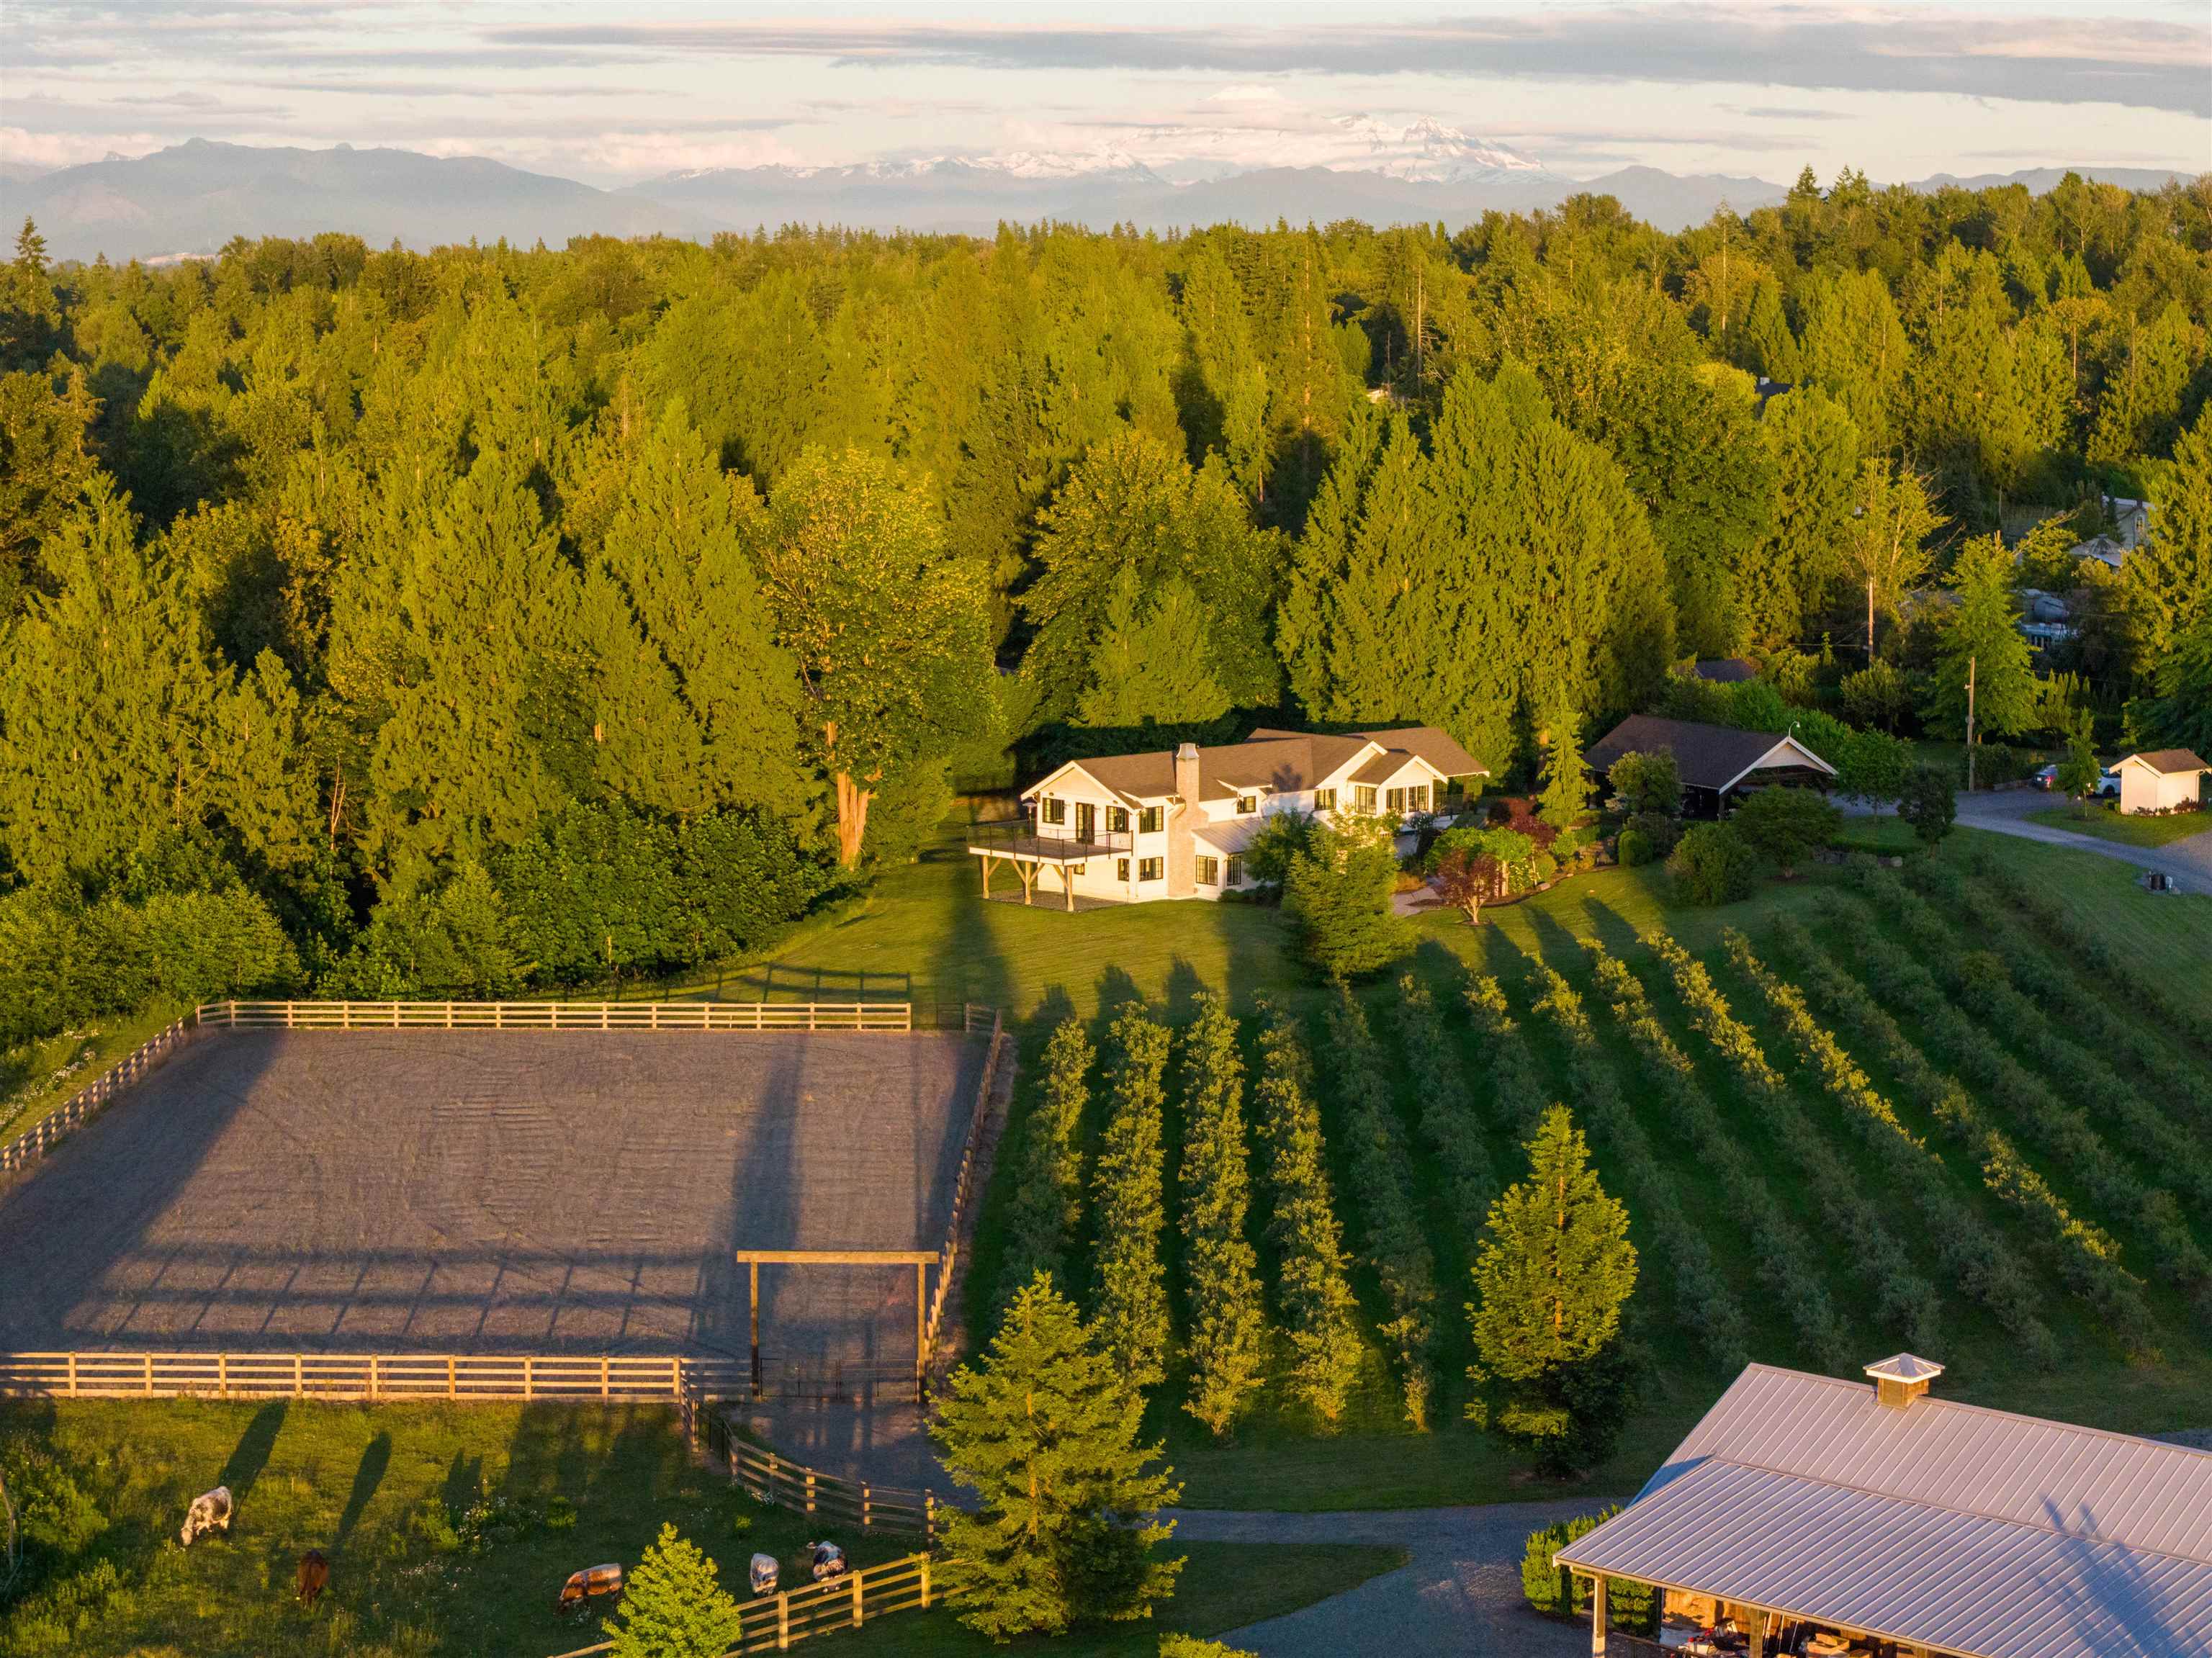
25125 72 Avenue
County Line Glen Valley · House · MLS® R3136345
$7,999,90066 acres · 1938
Sixty-six acres near Thunderbird Show Park, with a year built of 1938 on the sheet and what the listing calls a Georgie Award-winning residence: a 220 by 120 foot outdoor arena, a barn, a guest cottage and separate driveways for farm and house. The sheet shows a tax bill of $1,888 a year; a bill that low on land this size usually reflects farm classification, which is one reason acreages are left off the tax screen.
Property tax $1,888 a year
How These Were Chosen
The working, so you can check it.
1,384 active Langley listings were read on 6 October 2026, across every neighbourhood in the municipality: 607 houses, 407 condos, 276 townhouses and 94 of other kinds (manufactured homes, half duplexes and row houses), which are left off both tests. Three of September’s fifteen are here again because they passed again on the fresh read: 9230 212B Street at the same price, and 3215 197 Street and 4822 216 Street each $100,000 lower. Corrected later on 6 October 2026 from a second read of all active listings the same afternoon: every comparison group for houses now leaves out lots of an acre or more, as the picks themselves always did, and the tax report prints the same groups. Each one carries its exact dwelling type and its annual property tax,
both taken from the MLS® sheet rather than guessed. Homes are compared only
against others of the same type in the same neighbourhood, and only where at least
six such listings exist, so nothing is measured against an unlike set.
Property tax in British Columbia is assessed
value multiplied by the municipal rate, so within one town tax bills broadly follow assessed values. A price-to-tax ratio well below its group’s median is the signal. It is a screen, not a verdict: a low price-to-tax ratio says a listing is
worth reading, and it can also mean the assessment is for something other than a house, which is why a
C-2 mixed-use building in Aldergrove that passed the arithmetic in August was taken off the list on 16 September. It does not by itself establish that a property is
below assessed value. We publish the ratio, not an assessed value, and we do not
call it an assessment. New construction is left out, because a home the assessor
has not yet valued has nothing to measure against.
A listing that fails these tests is simply
not here.
Listings courtesy of cooperating
brokerages via MLS® reciprocity. Selection and commentary are our own. Prices,
taxes and availability are as published on the MLS® sheet and change daily.
Nothing here is an appraisal.
Past editions
Each month’s Fifteen stays on the shelf as it was published, so anyone can check what we said against what happened.
Get the next Fifteen, and The Langley Market Report.
Each month, The Langley Market Report by email, with every new report we published that month and the next Fifteen. One email a month, and you can stop it any time.
Nothing else is sent, and never to anybody else.