The Fifteen · September 2026
Archived edition, as published in September 2026. Prices and availability are as they were then. The current Fifteen is at langley.ai/picks.
Fifteen Langley listings worth a second look.
Chosen by reading all 1,394 of them.
Every active listing in Langley, 1,394 of them, went through the same three tests
for the August 2026 edition; since then the fifteen have been checked against the live feed and re-picked where a listing left the market or failed a tightened test, on the dates recorded at the foot of the page. The first finds homes priced low against the property tax they carry,
which is the closest honest read on what the assessor thinks they are worth. The
second finds homes priced low by the square foot against their own neighbourhood
and property type. The third is not arithmetic at all: land, water, working
ground and houses built before the war. Five from each, and the working is shown
on every one.
One · The Tax Tell
Priced under what the taxman thinks.
Property tax in British Columbia is assessed value multiplied by the municipal rate, so within one town a home’s tax bill is a straight read on what the assessor believes it is worth. When a listing’s price sits far below the tax it carries, that is a signal worth checking, not a proof: tax class, exemptions and the assessment date all move a bill. This is a screen. Each of these five passed it against the median for its own property type in its own neighbourhood, and each card states the group, the median and the day it was read so the percentage can be reproduced.
How these five were chosen
The test.
Take a listing’s asking price and divide it by the annual property tax printed on its own
MLS® sheet. Compare that ratio against the median
ratio for the same dwelling type in the same neighbourhood. A house is only ever measured
against other houses on its own streets, never against condos and never against another sub-area.
Why it works.
Property tax in British Columbia is assessed value multiplied by the municipal rate. Within one
municipality the rate is the same for everybody, so a home’s tax bill moves in lockstep with
what the assessor thinks it is worth. A price far below the tax it carries is a reason to look, and only that: the Township taxes residential, commercial and farm class at different rates, so the screen is run in residential class only: each listing is measured against the median for its own dwelling type in its own neighbourhood (houses against houses, condos against condos, townhouses against townhouses), and anything whose bill is not a residential bill is left off. Each card shows the gap, the group size, the median ratio and the tax year.
What is excluded, and why.
New construction showing $0 tax or a pre-2025 tax year, because the assessor has not valued it yet
and there is nothing to measure. Any group with fewer than six comparable listings, because a median drawn from four homes is too few to compare against with any confidence. Anything not in residential class (a mixed-use or commercial building, a co-operative share, a farm-class parcel), because its tax bill is not a residential assessment and cannot be compared with one. And land assembly sites, whose taxes reflect development
potential rather than the house: those live on the land
page instead.
We publish the ratio, not an assessed value, and we
never call it an assessment. The tax figure comes from the listing sheet, which we are licensed to
display.
 01
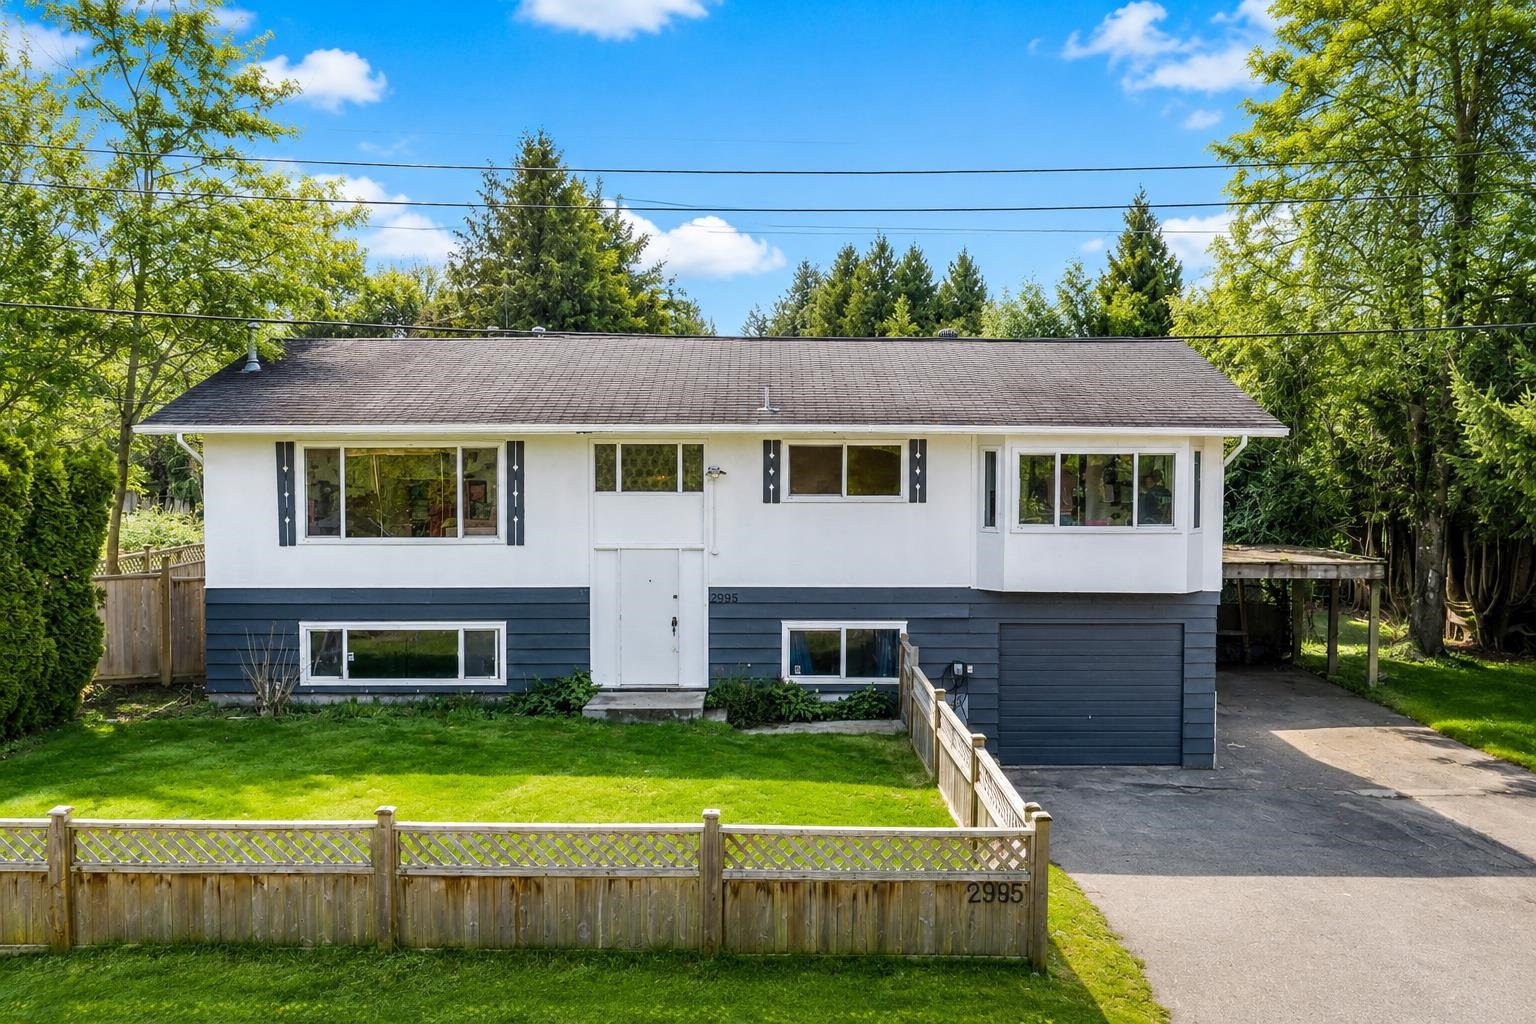
2995 268A Street
Aldergrove · House · MLS® R3150205
$1,025,00016% below its type median
A 1969 house of 2,147 square feet on an 11,635-square-foot corner lot, asking $1,025,000 and paying $4,322 a year. Against the median price-to-tax ratio of the fifty Aldergrove houses read on 15 September (281 dollars of price per dollar of tax), that bill belongs to a home asking about $1.21 million; at $477 a foot it also sits 13% under the neighbourhood’s $547 median, so both screens fire at once. Updated kitchen, new furnace, a lot big enough to matter under the small-scale housing rules.
Property tax $4,322 a year (2026 sheet) · group of 50 Aldergrove houses, median ratio 281, read 15 September 2026
 02
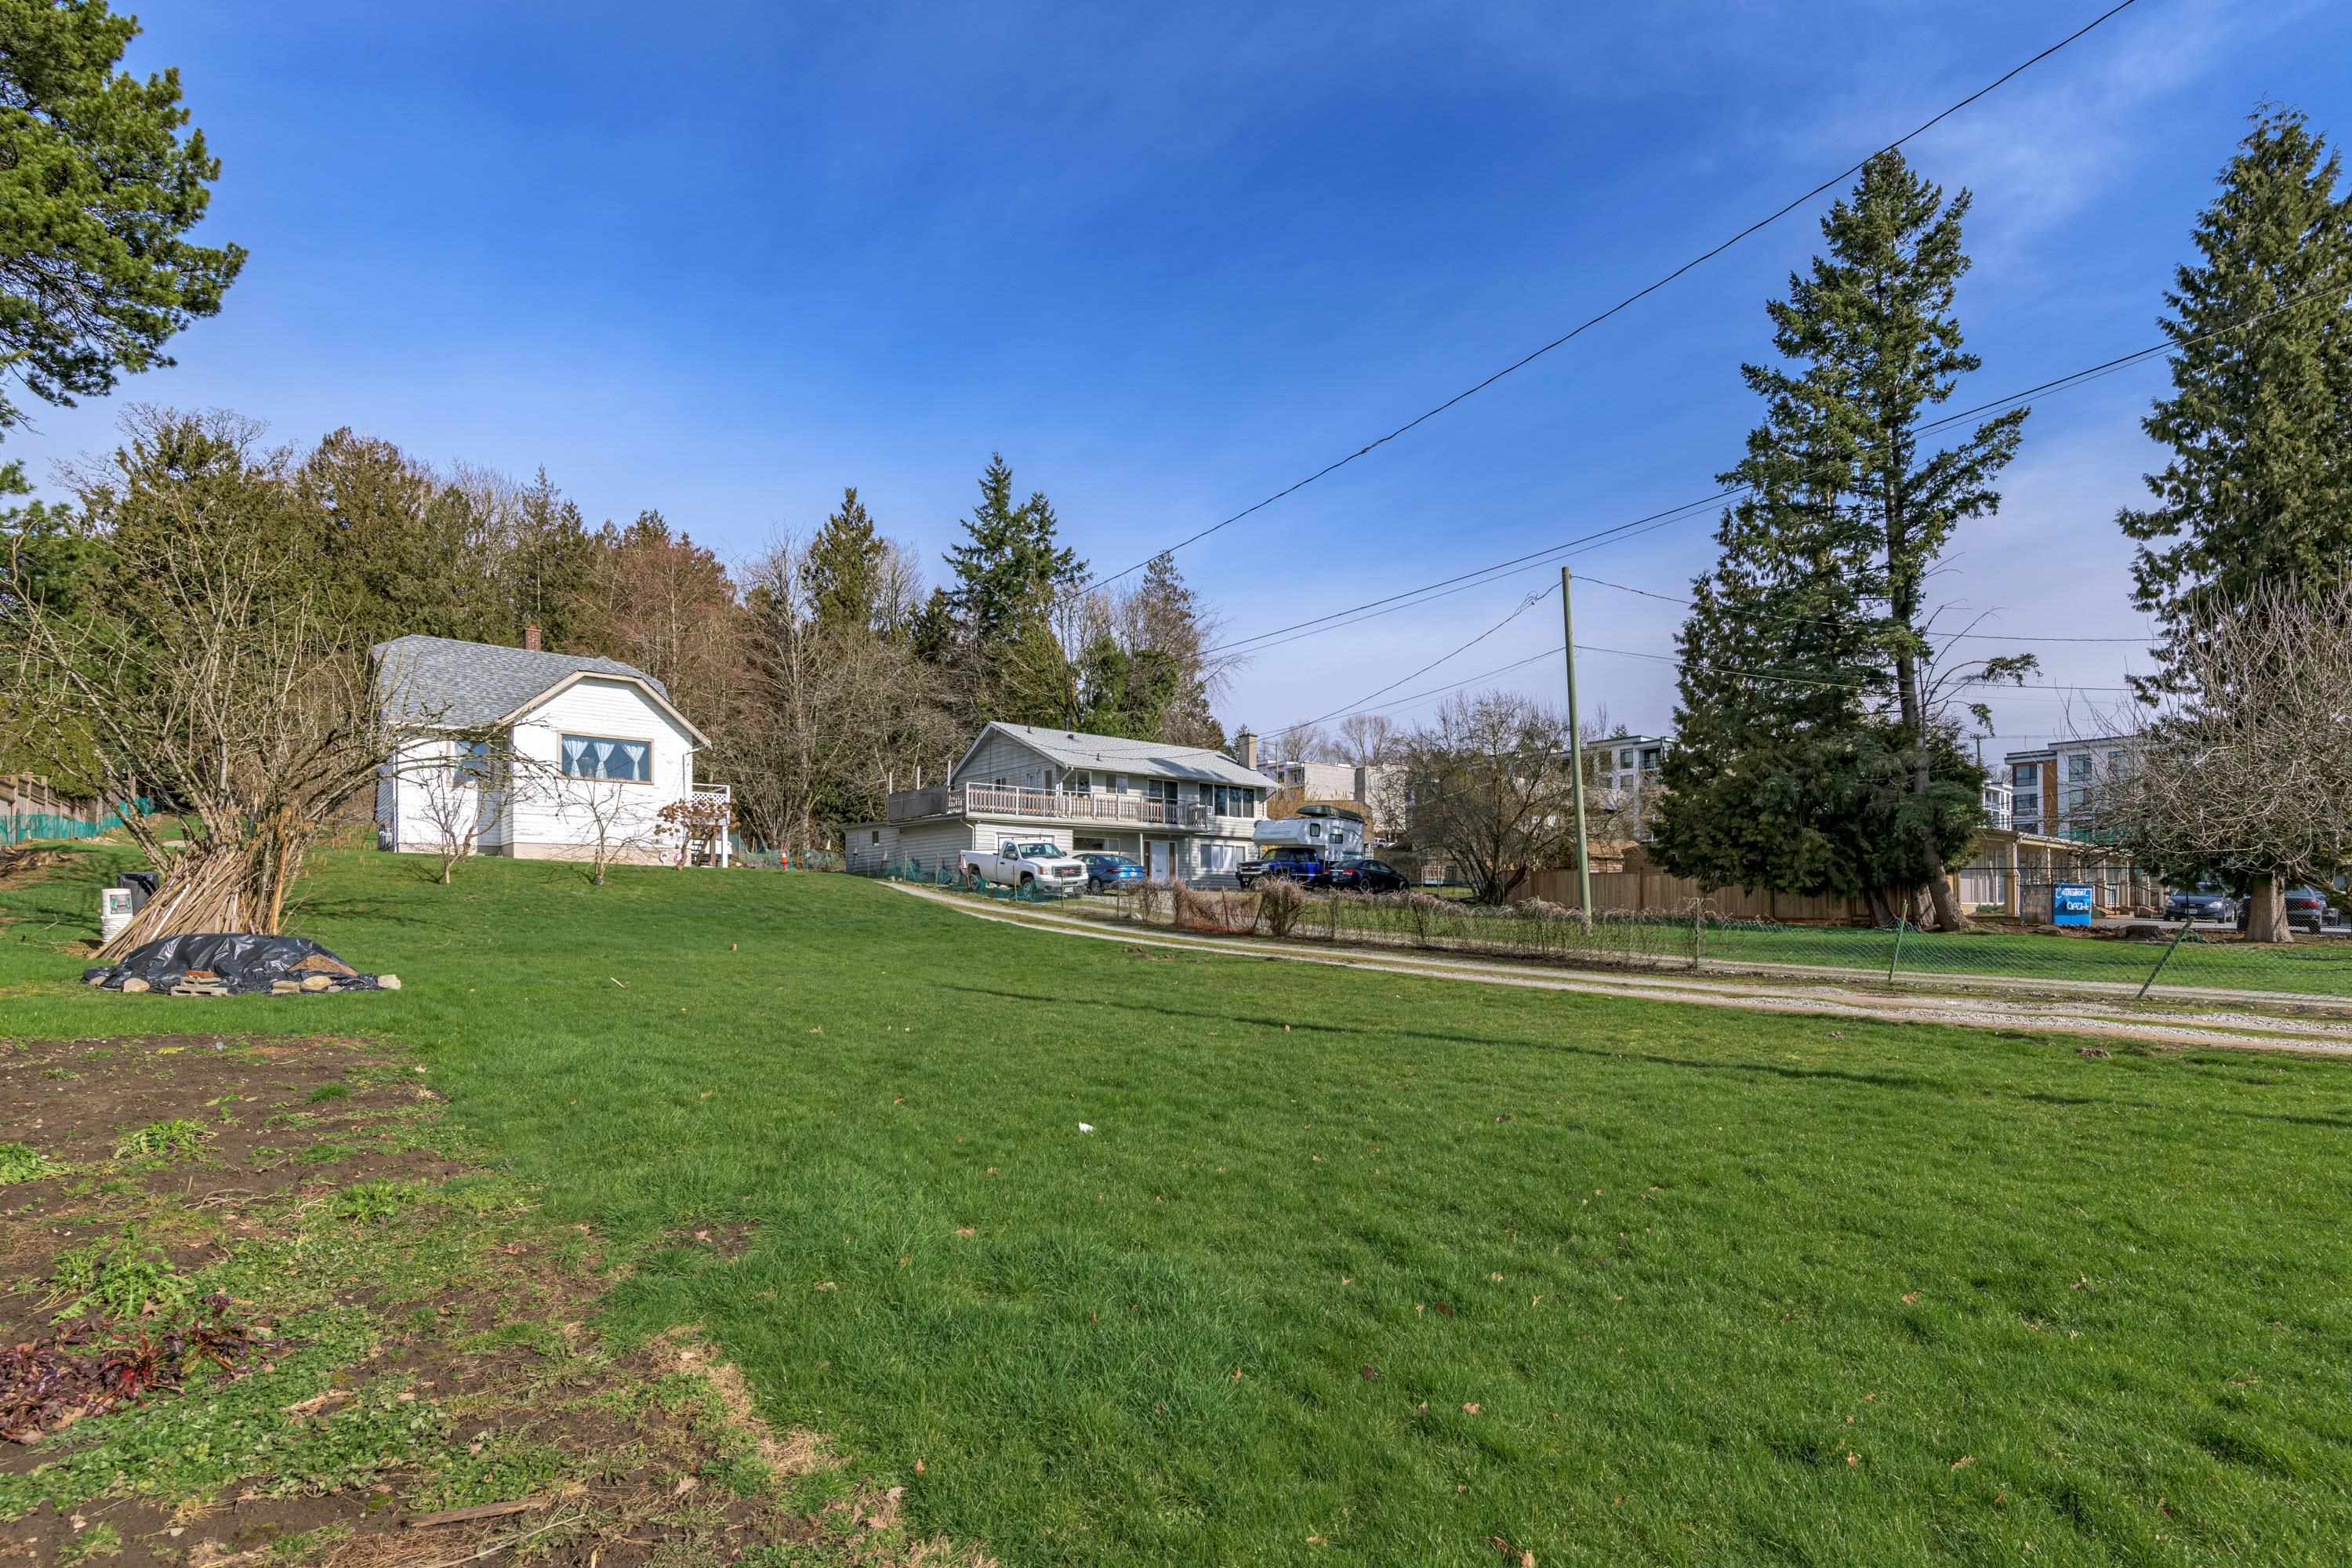
19957 68 Avenue
Willoughby Heights · House · MLS® R3161310
$1,399,99933% below its type median
Back on the market in September under a new listing number at $1,399,999, which is $230,000 under its August asking. A 1940 house on 20,473 square feet, nearly half an acre inside Willoughby, paying $7,489 a year: at the neighbourhood’s median price-to-tax ratio for a house, that tax bill belongs to a home asking around $2.07 million. The listing itself says priced below assessed value; the arithmetic agrees. The price is for the land, so the Property Intelligence Report comes first.
Property tax $7,489 a year (2025 sheet) · group of 87 Willoughby Heights houses, median ratio 277, read 15 September 2026
 03
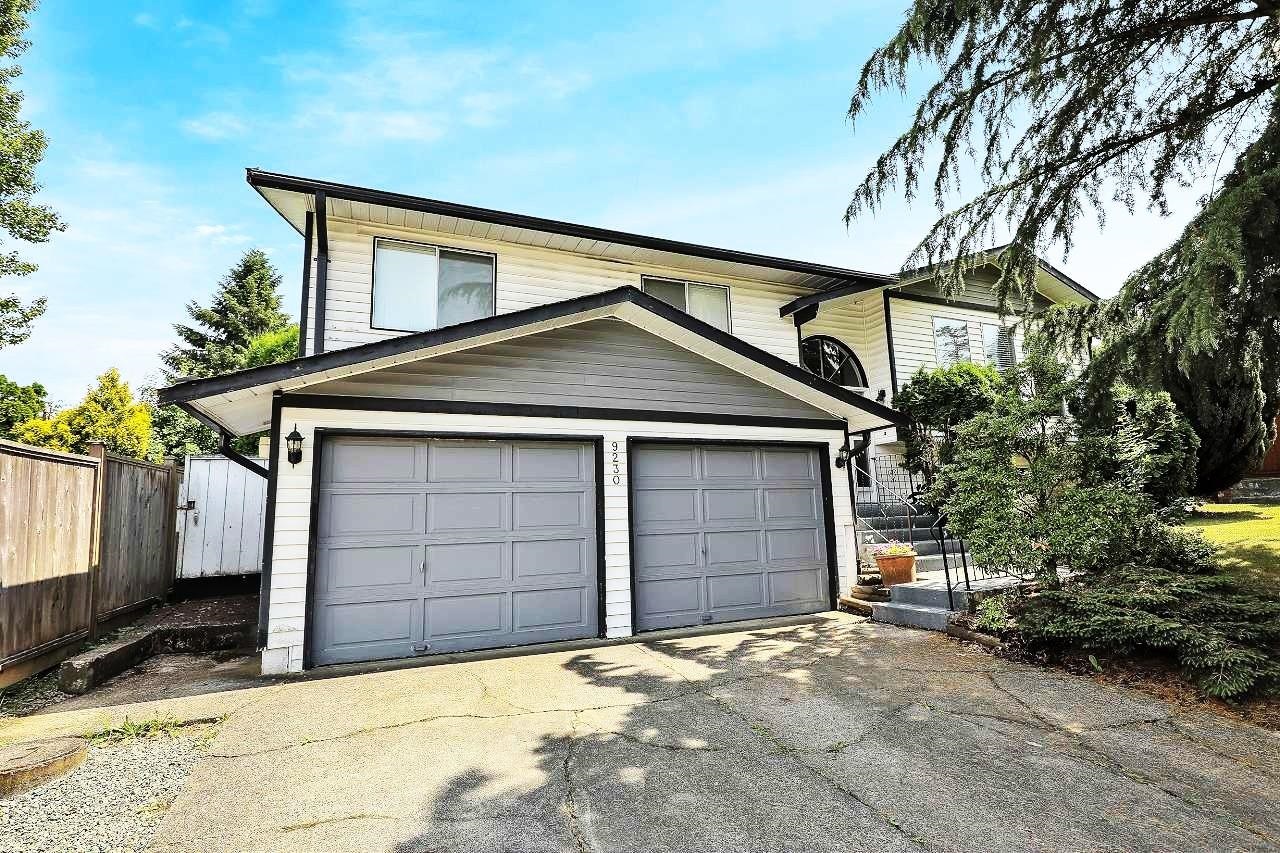
9230 212B Street
Walnut Grove · House · MLS® R3160446
$1,049,90023% below its type median
The widest tax gap among the thirty-five Walnut Grove houses read on 15 September: $1,049,900 asking against $4,821 a year, a ratio of 218 where the neighbourhood’s median is 282. At that median the tax bill belongs to a home asking about $1.36 million. A 1983 four-bedroom on a cul-de-sac, 2,136 square feet at $492 a foot (17% under the $591 median), last updated about twenty years ago and priced like it; suite potential through the garage. Walnut Grove held its value best of any Langley neighbourhood this year, which is the other reason it is here.
Property tax $4,821 a year (2026 sheet) · group of 35 Walnut Grove houses, median ratio 282, read 15 September 2026
 04
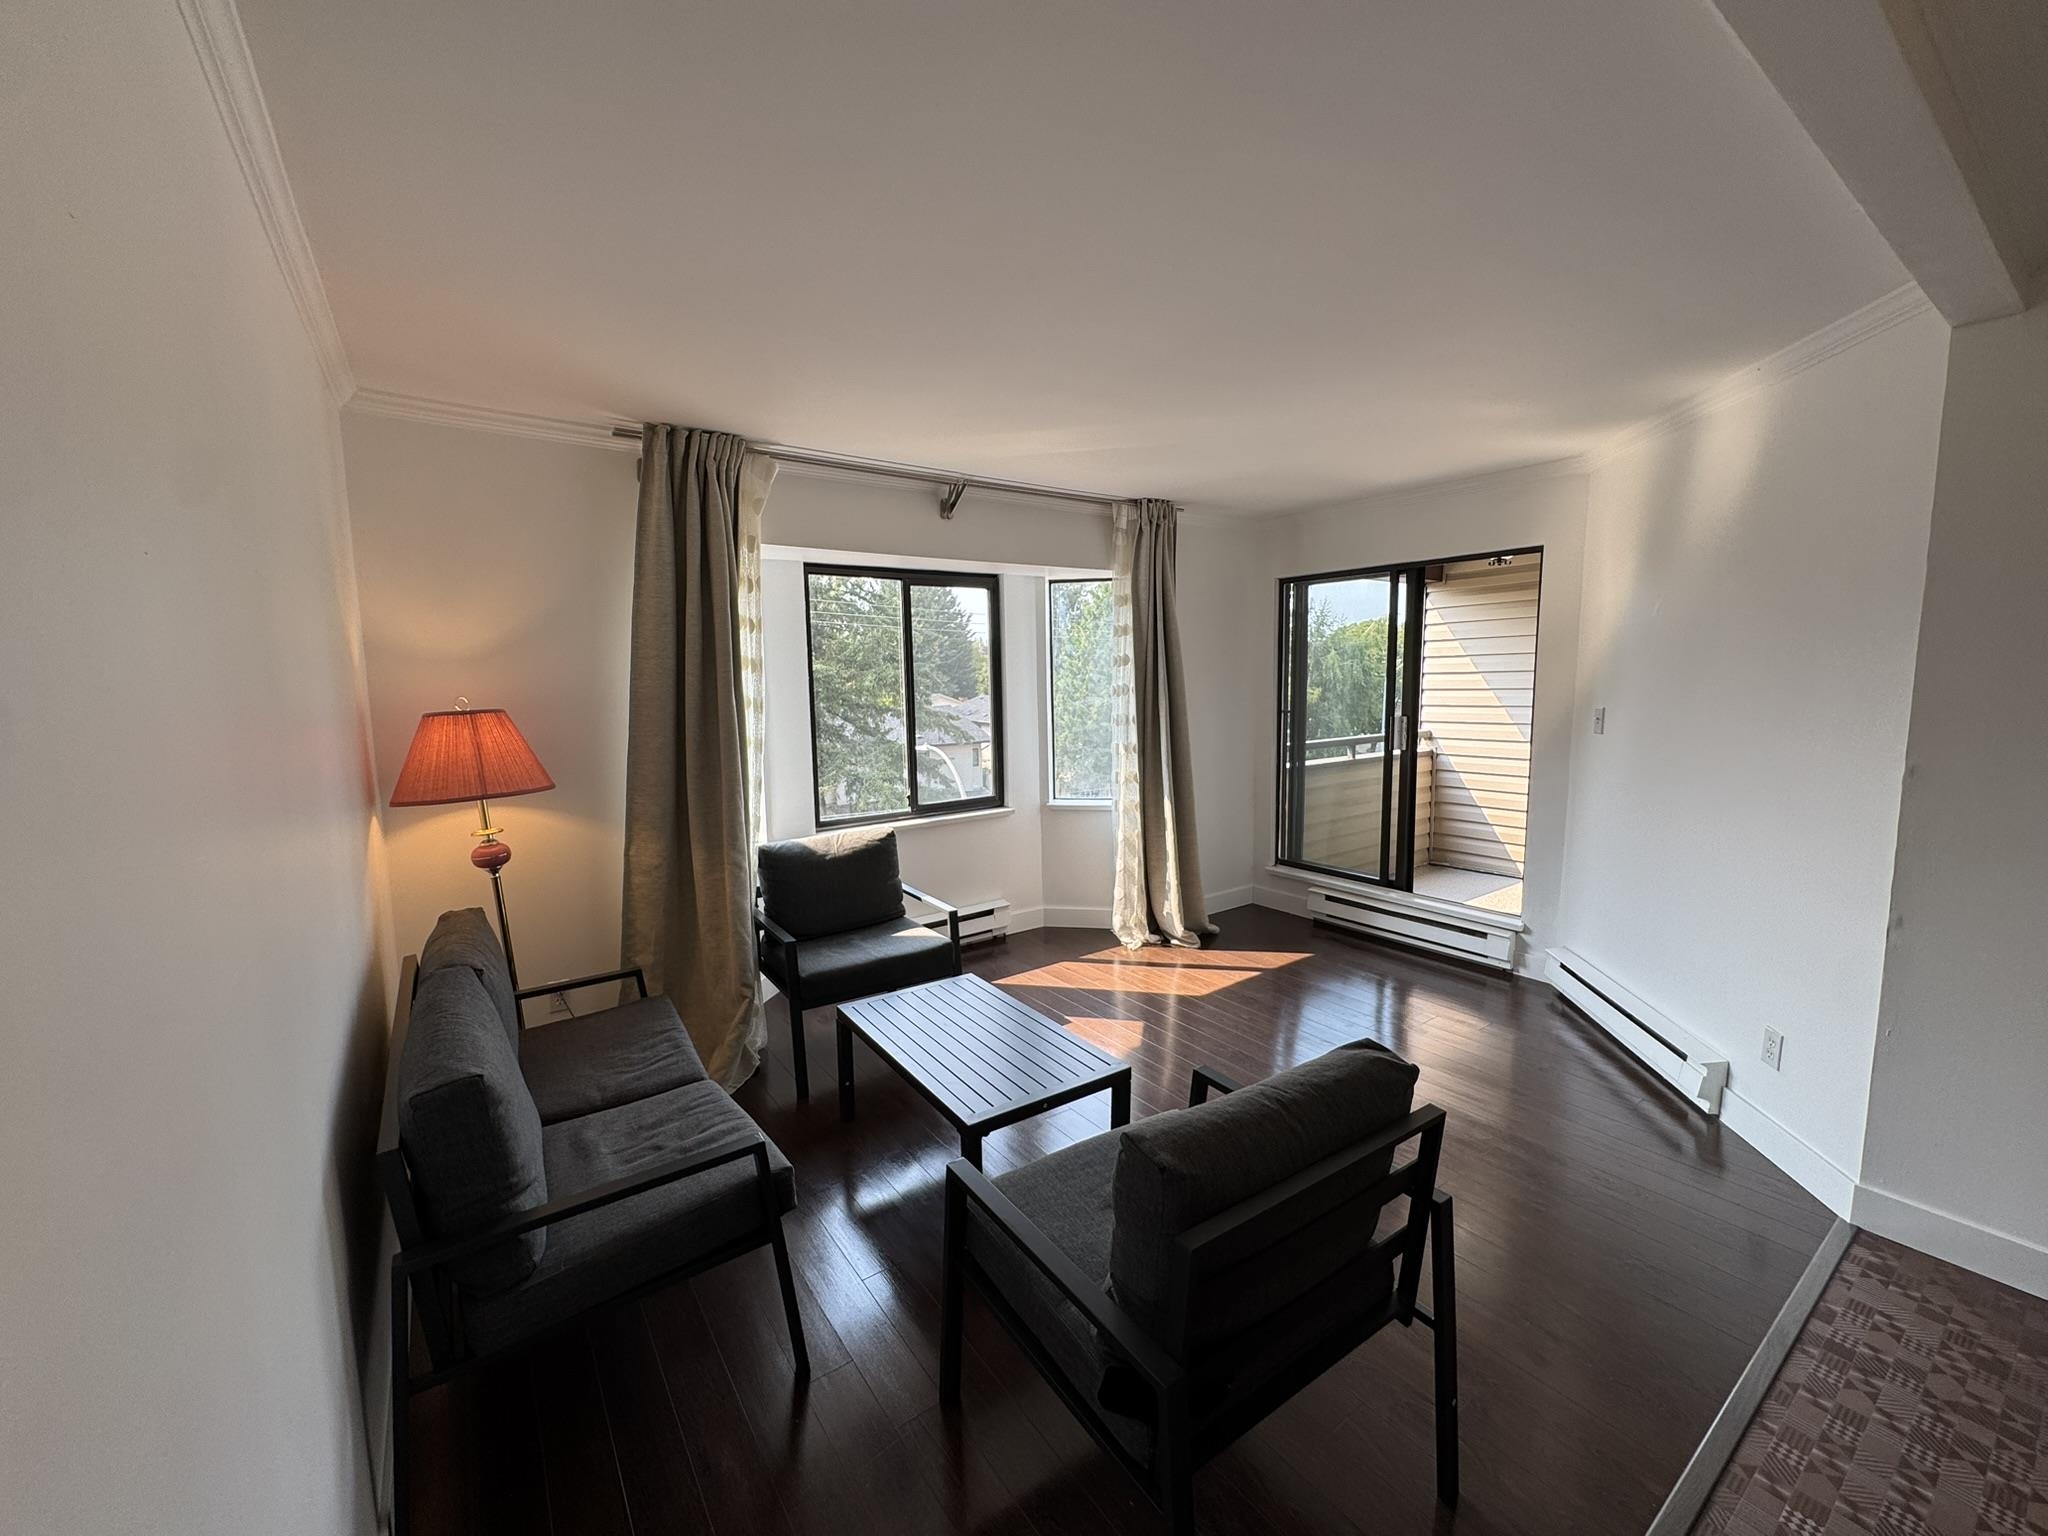
314 5294 204 Street
Langley City · Condo · MLS® R3157418
$314,99545% below its type median
Langley City has the lowest composite benchmark in the municipality, and its condo benchmark fell 9.0% in the year to August 2026, among the steeper condo falls in Langley (Fort Langley 12.3%, Willoughby 9.3%, Walnut Grove 9.1%, Langley City 9.0%). This 662 square foot apartment asks $314,995 against a $2,575 tax bill, which is the profile of a considerably more expensive unit. The cheapest door into Langley ownership, and it got cheaper.
Property tax $2,575 a year (2026 sheet) · group of 83 Langley City condos with a valued tax bill (103 listed), median ratio 223, read 19 September 2026
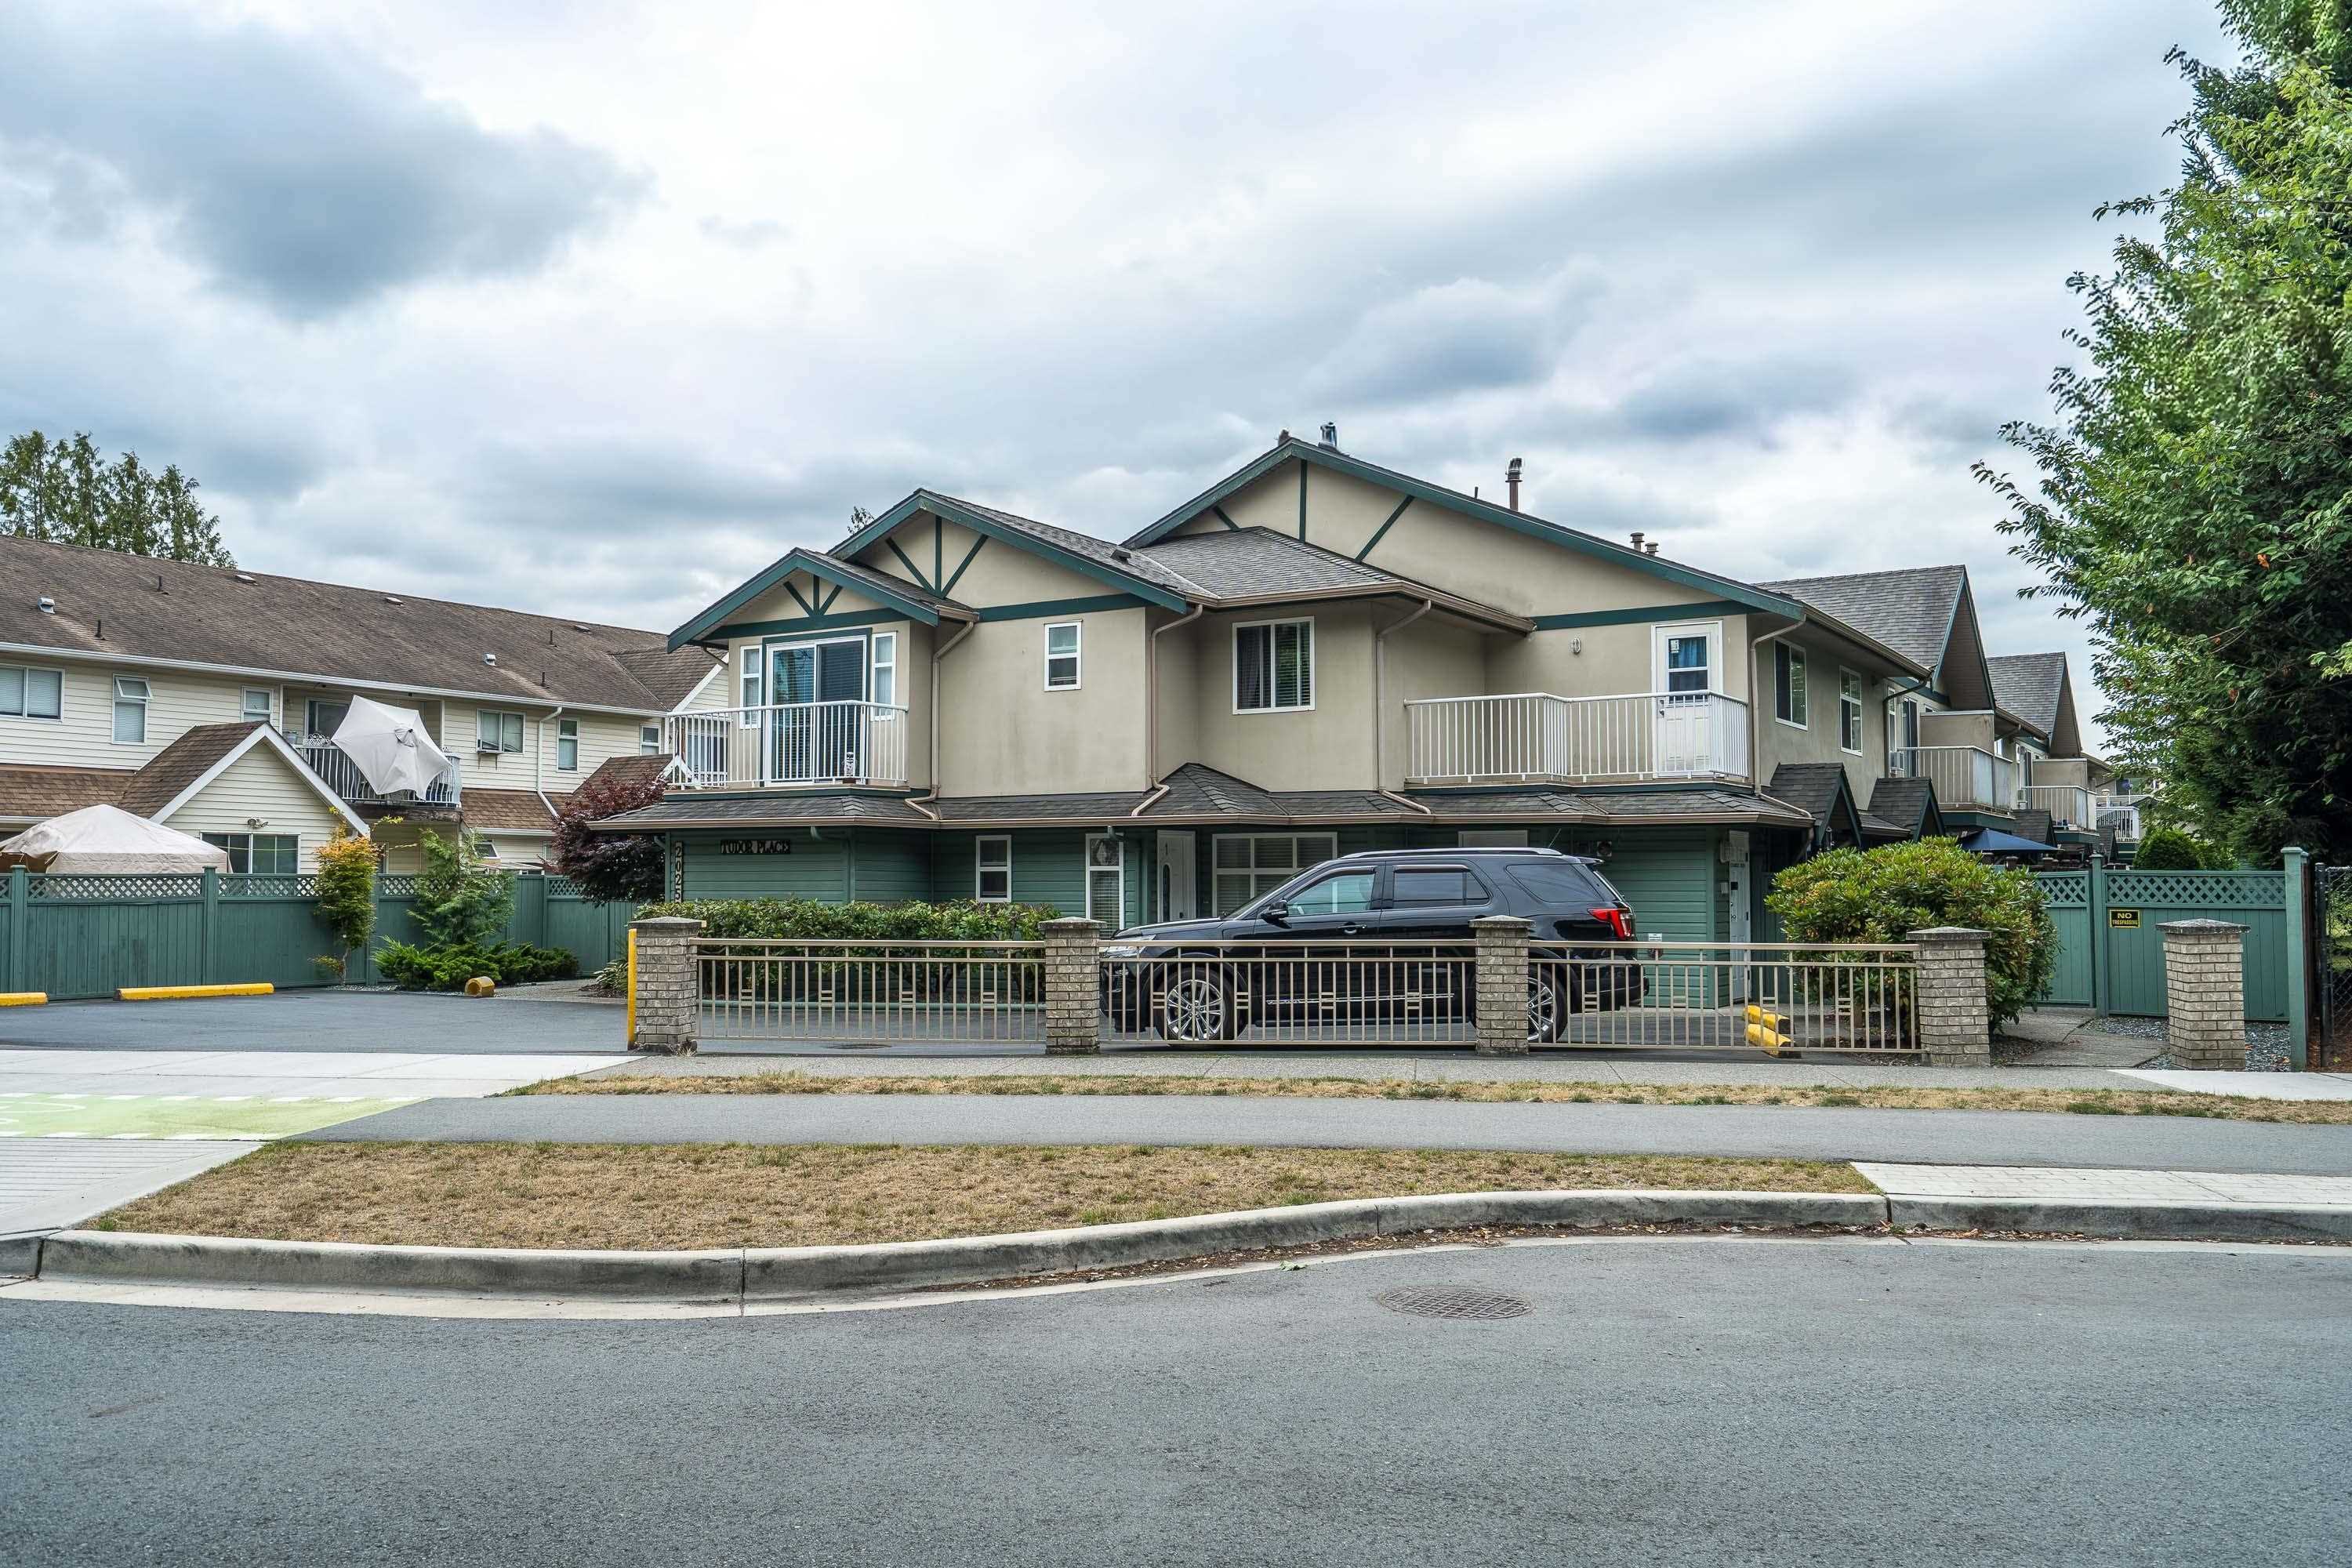 05
2 20258 Michaud Crescent
Langley City · Townhouse · MLS® R3142110
$499,90043% below its type median
Townhomes are the tightest segment in Langley: 4.3 months of supply and 98.1% of asking price in the September 2026 report, the fastest townhome market of any area on the board. Finding one under half a million with a $3,930 tax bill behind it is the exception rather than the pattern, and tight segments do not usually leave exceptions sitting.
Property tax $3,930 a year (2026 sheet) · group of 38 Langley City townhouses with a valued tax bill (39 listed), median ratio 223, read 19 September 2026
Two · Space For The Money
Where the numbers quietly work.
Nothing dramatic in these, which is rather the point. Each is a large home priced like a smaller one: dollars per square foot well under the median for its own type in its own neighbourhood. No story, no urgency, just more house than the number suggests.
How these five were chosen
The test.
Asking price divided by finished floor area, compared against the median dollars per square foot
for the same dwelling
type in the same neighbourhood. Ranked by how far under that median they sit, from
51% to 39%.
Why it is a separate test.
The tax measure and the square-foot measure can disagree, and when they do it is usually telling you
something. A home can be priced fairly against its tax and still be unusually large for the money,
or the reverse. Running both independently and showing you which one fired is more honest than
blending them into one score you cannot check.
The guard.
Anything above 1.4 times its neighbourhood’s median dollars per square foot is dropped, which
removes land plays priced for what can be built rather than what stands there. One listing per
neighbourhood and type, so five picks means five different corners of Langley.
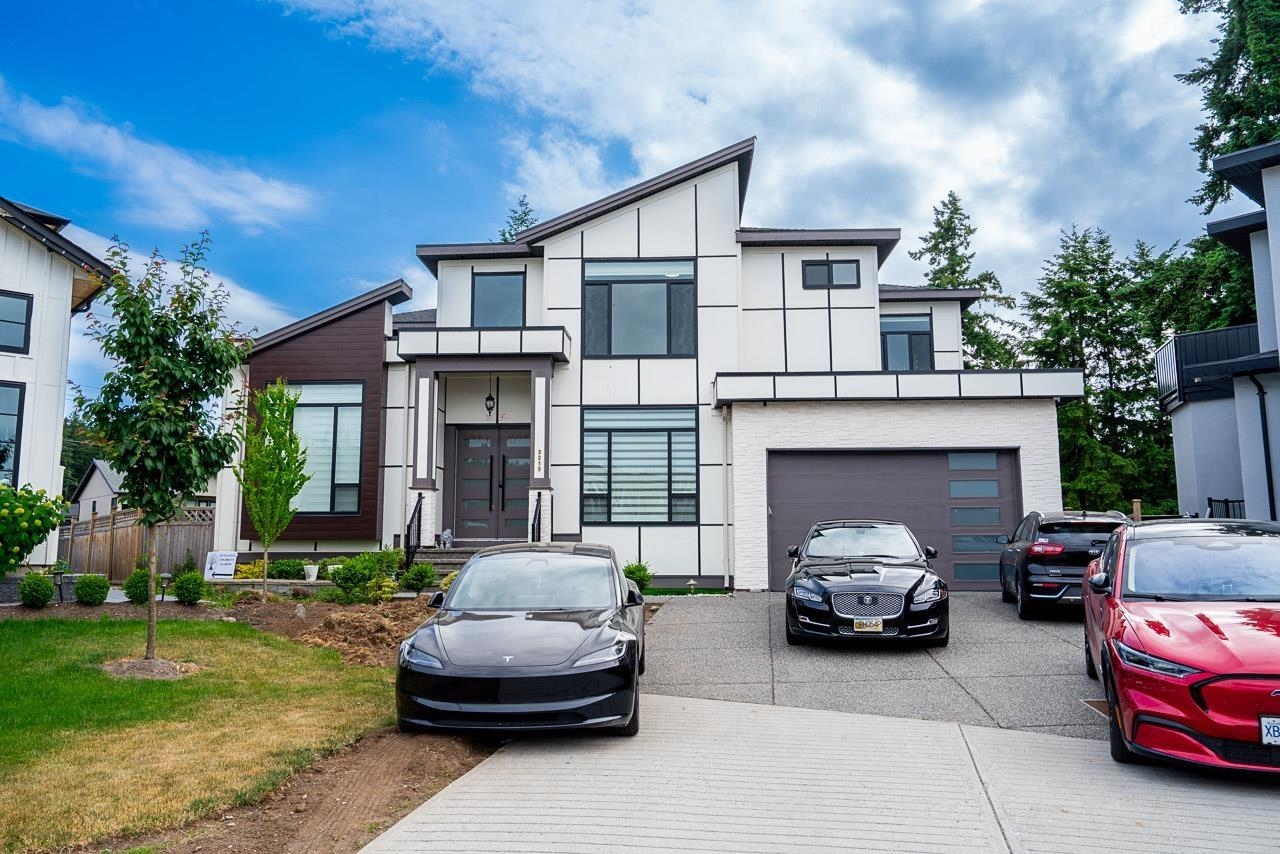 06
3215 197 Street
Brookswood · House · MLS® R3156665
$2,149,000$320/sq ft · 51% under
6,715 square feet, built 2021, at $320 a foot. Half the Brookswood median for a detached home, and four years old. It also sits 24% under its type median on the tax measure, so two separate tests point the same way.
Property tax $9,914 a year
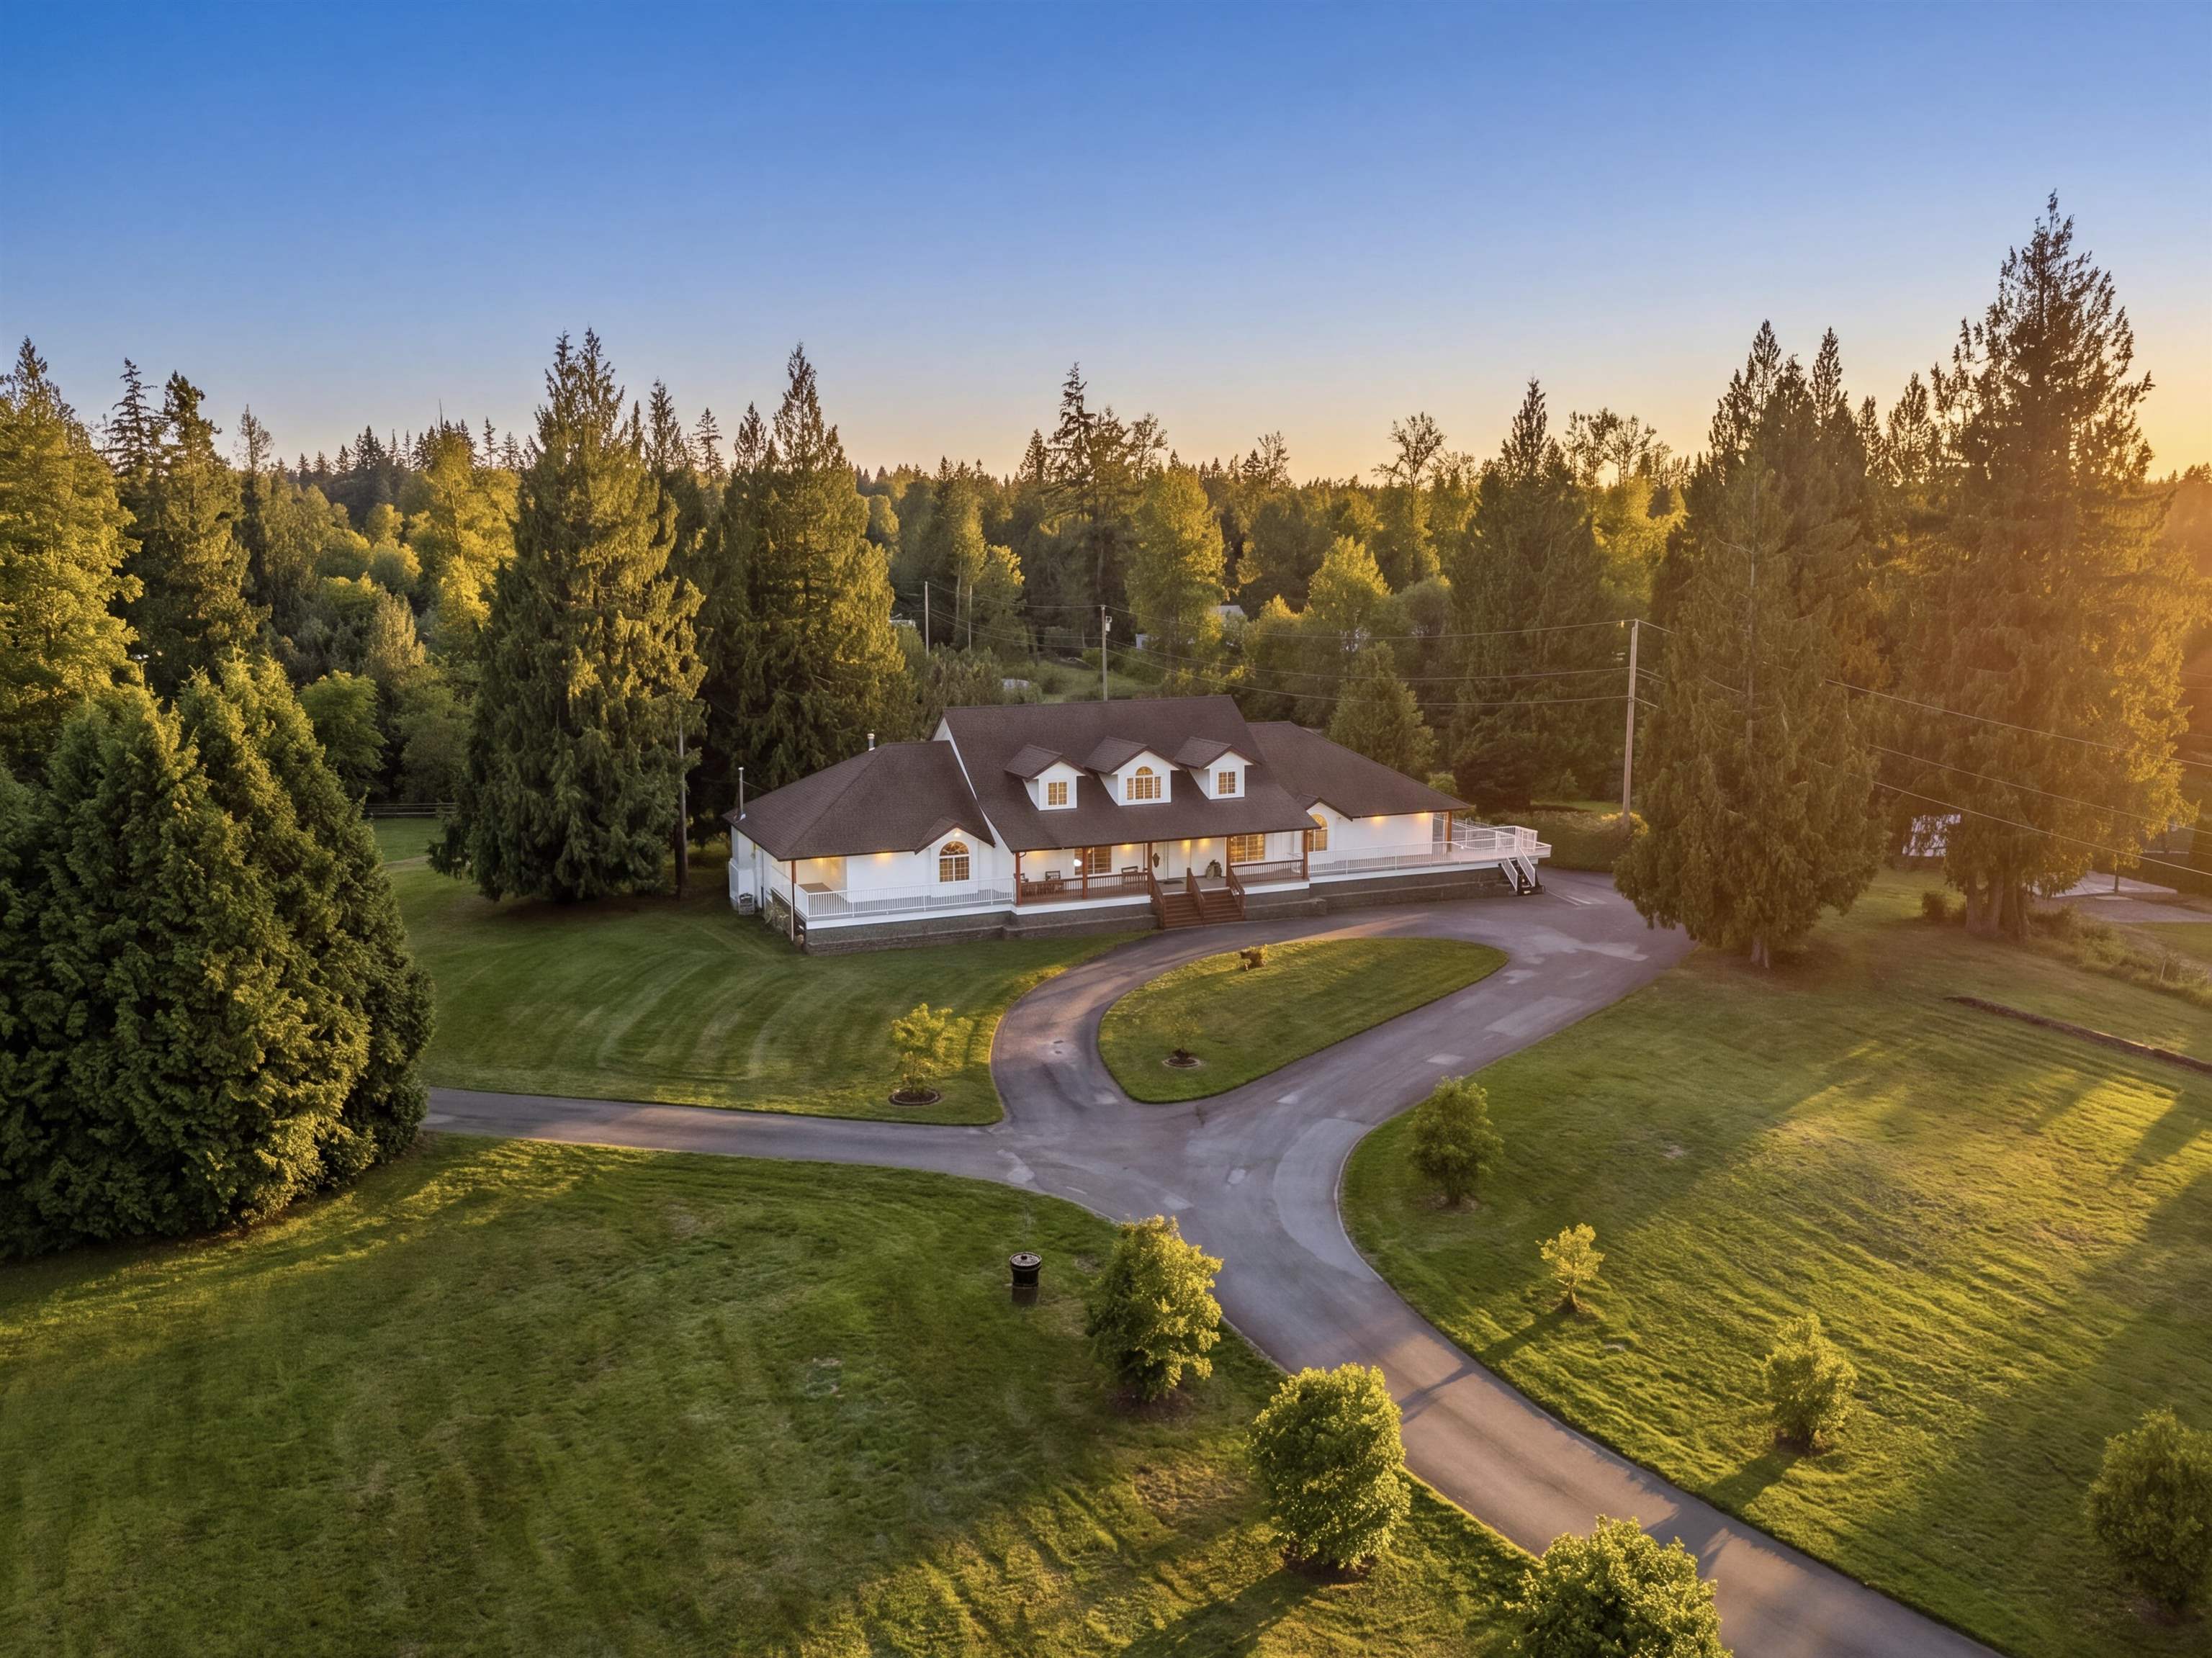 07
21980 100 Avenue
Fort Langley · House · MLS® R3133119
$2,976,000$394/sq ft · 46% under
Fort Langley carries a 38% detached premium over Langley as a whole in the September 2026 report ($2,045,200 against $1,479,400), which is what makes 7,549 square feet at $394 a foot worth stopping on. The village premium is real and it is measured; this listing does not carry it.
Property tax $9,532 a year
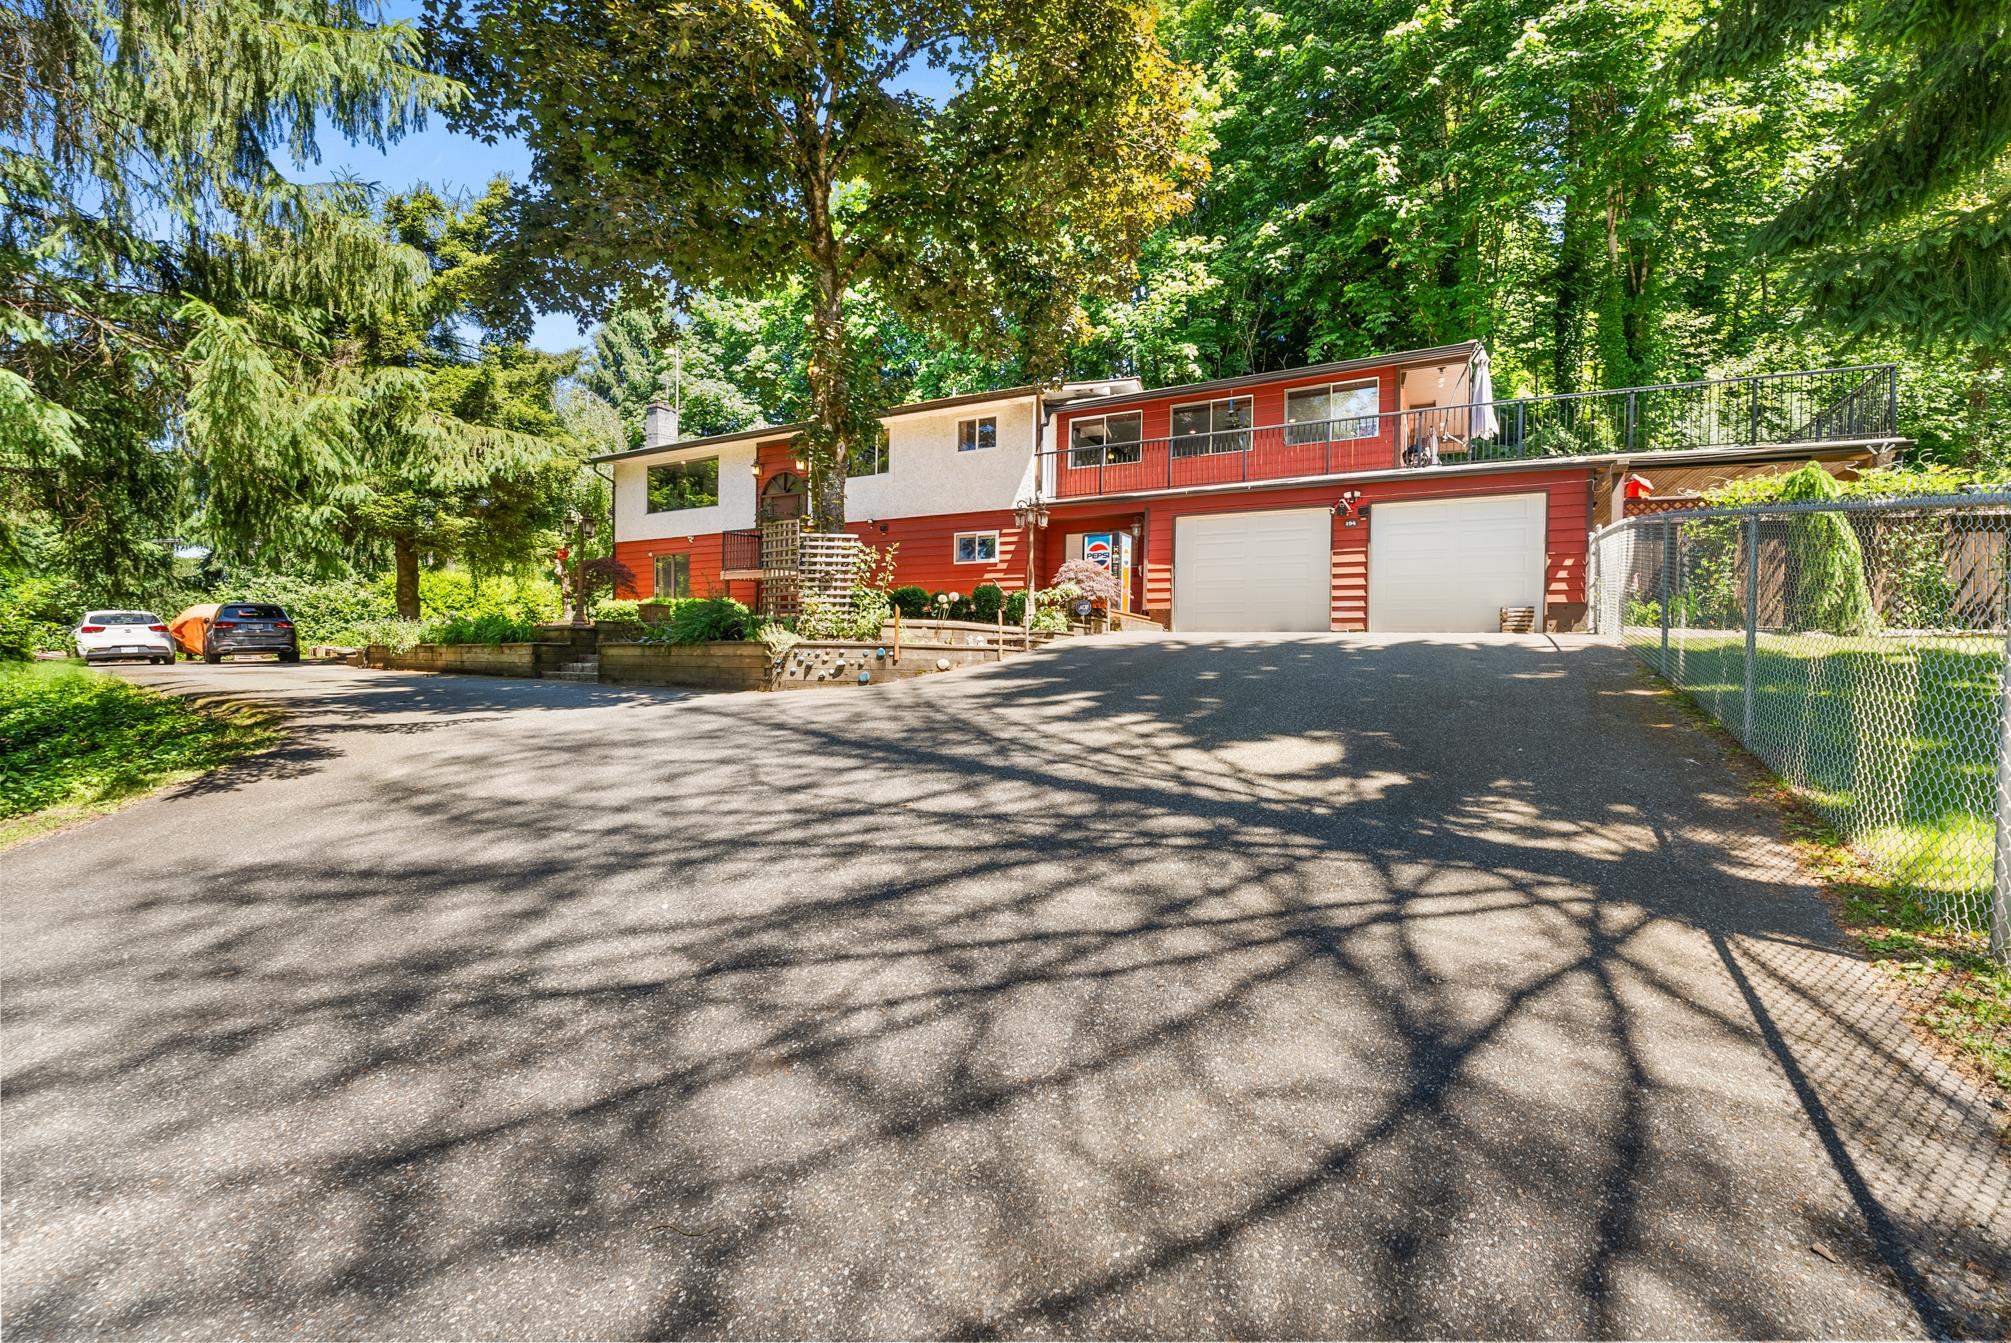 08
194 Clovermeadow Crescent
Salmon River · House · MLS® R3079706
$1,299,000$415/sq ft · 42% under
Salmon River held better than any Langley neighbourhood this year on the composite benchmark, down 2.3% against a municipality down 6.6% in the September 2026 report. A 3,130 square foot home at $415 a foot in the sub-area that gave back the least is an unusual combination.
Property tax $5,050 a year
 09
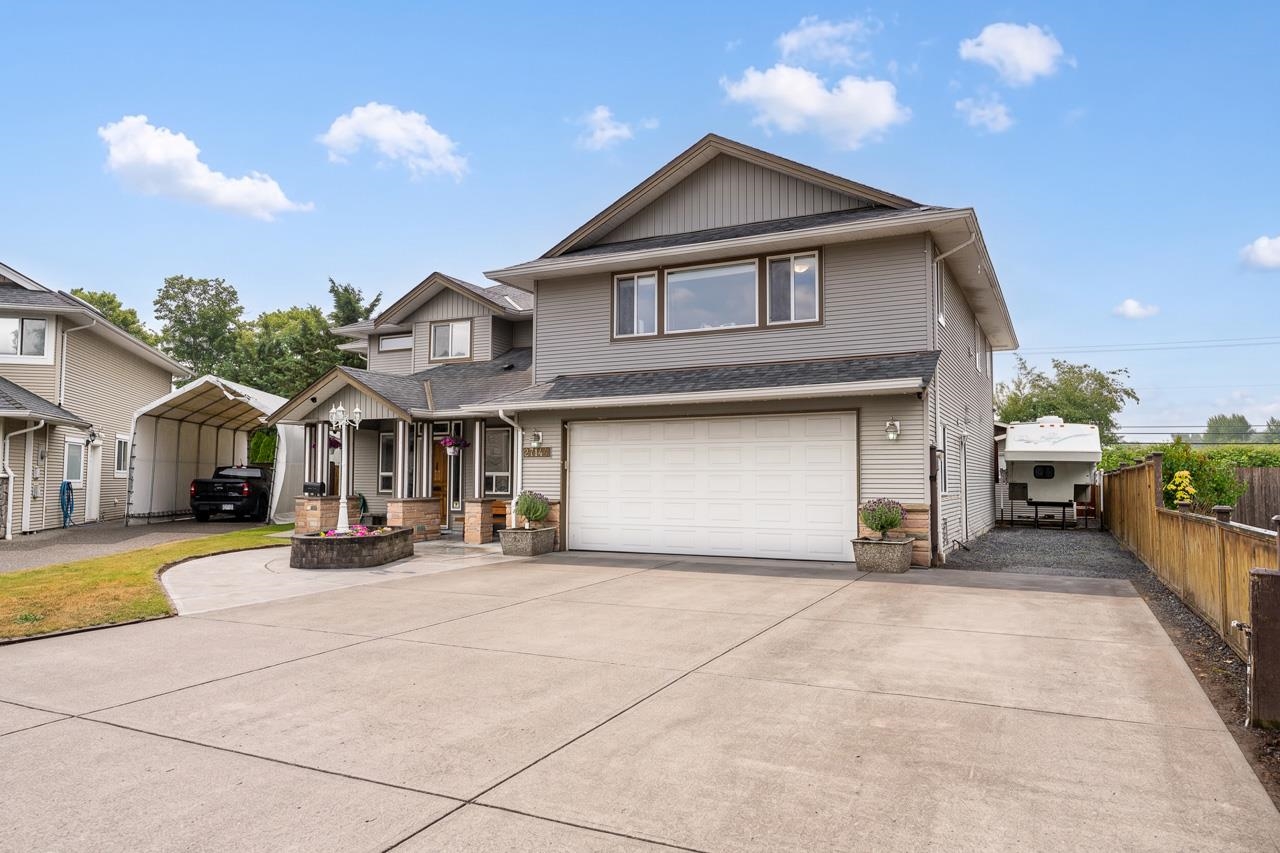
27144 25A Avenue
Aldergrove · House · MLS® R3150344
$1,448,000$326/sq ft · 41% under
Aldergrove already holds the lowest detached benchmark in Langley, $394,700 under the municipal figure in the September 2026 report. This is 4,442 square feet at $326 a foot inside that: the discount within the discount.
Property tax $5,498 a year
 10
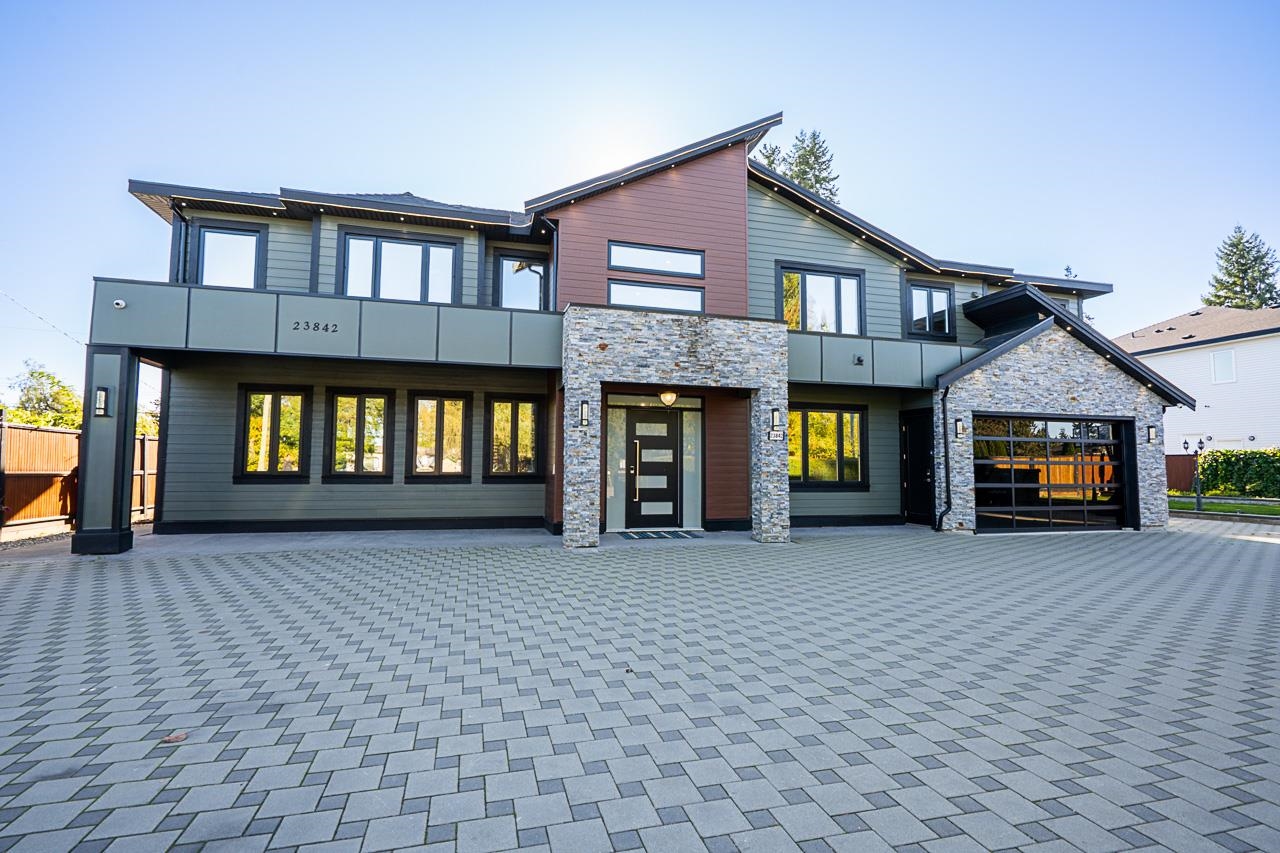
23842 Old Yale Road
Campbell Valley · House · MLS® R3146179
$2,399,000$451/sq ft · 39% under
Campbell Valley has the highest detached benchmark in Langley at $2,539,300. A 2020-built home of 5,322 square feet asking below that, at $451 a foot, is priced under its own neighbourhood on both counts.
Property tax $8,462 a year
Three · The Ones With A Story
Simply worth looking at.
Not chosen on arithmetic. These are the listings that stopped us: land, water, working ground, and houses that were standing before the war. One from each corner of Langley, because a place this varied should not be represented by one street.
How these five were chosen
No arithmetic at all.
These are found by reading, not ranking. We scan every public remark in the municipality for the
things that do not show up in a price: acreage, water on the land, working ground, and a year built
before 1955. Then a person picks.
Why the section exists.
A list chosen only by numbers would be five suburban houses that happen to be cheap. Some of what
is worth seeing in Langley is worth seeing because it is nearly gone: a 1908 house on its original
street, a pre-war farmhouse on land with a creek through it. Those never rank well on dollars per
square foot and they should not have to.
The rule.
One per neighbourhood, so a place this varied is not represented by one street. These are not
claimed to be good value. They are claimed to be worth looking at, which is a different thing and
we say so.
 11
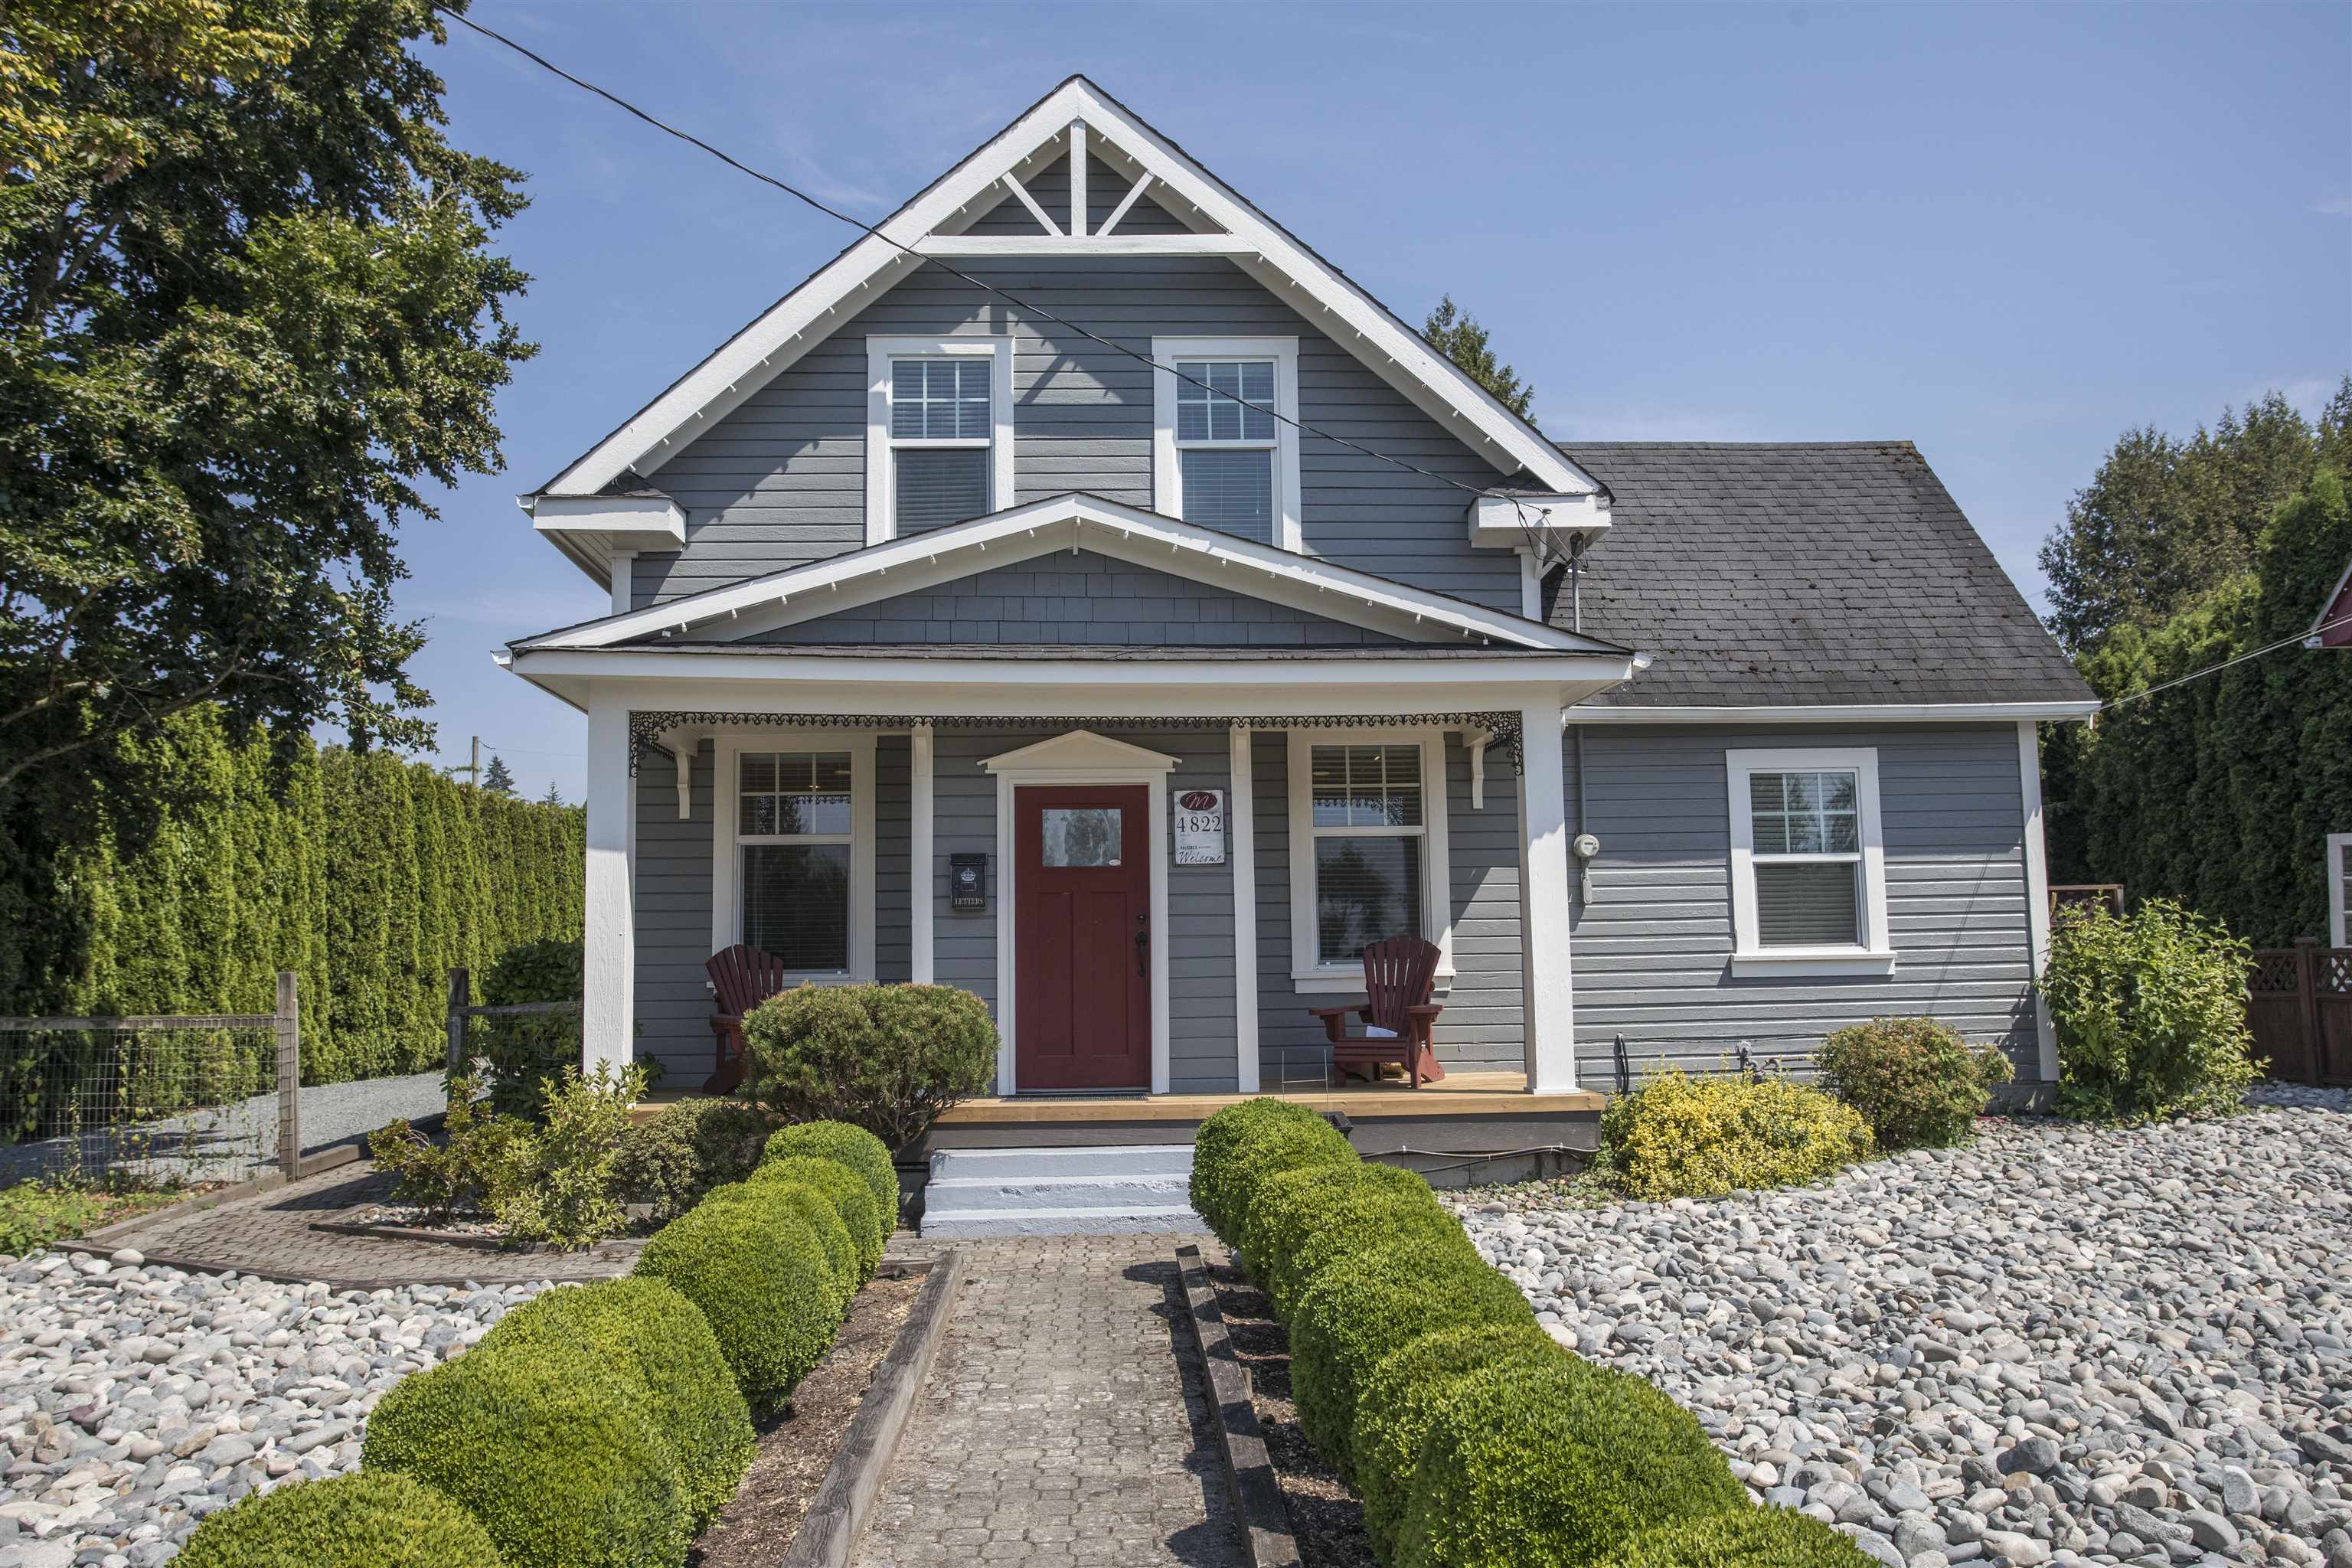
4822 216 Street
Murrayville · House · MLS® R3149729
$1,298,000Built 1908
A hundred and eighteen years old and still on its street in Murrayville. Very little in Langley predates the First World War, and almost none of it comes to market. Whatever the arithmetic says, houses like this are finite and the number of them only goes one way.
Property tax $4,445 a year
 12
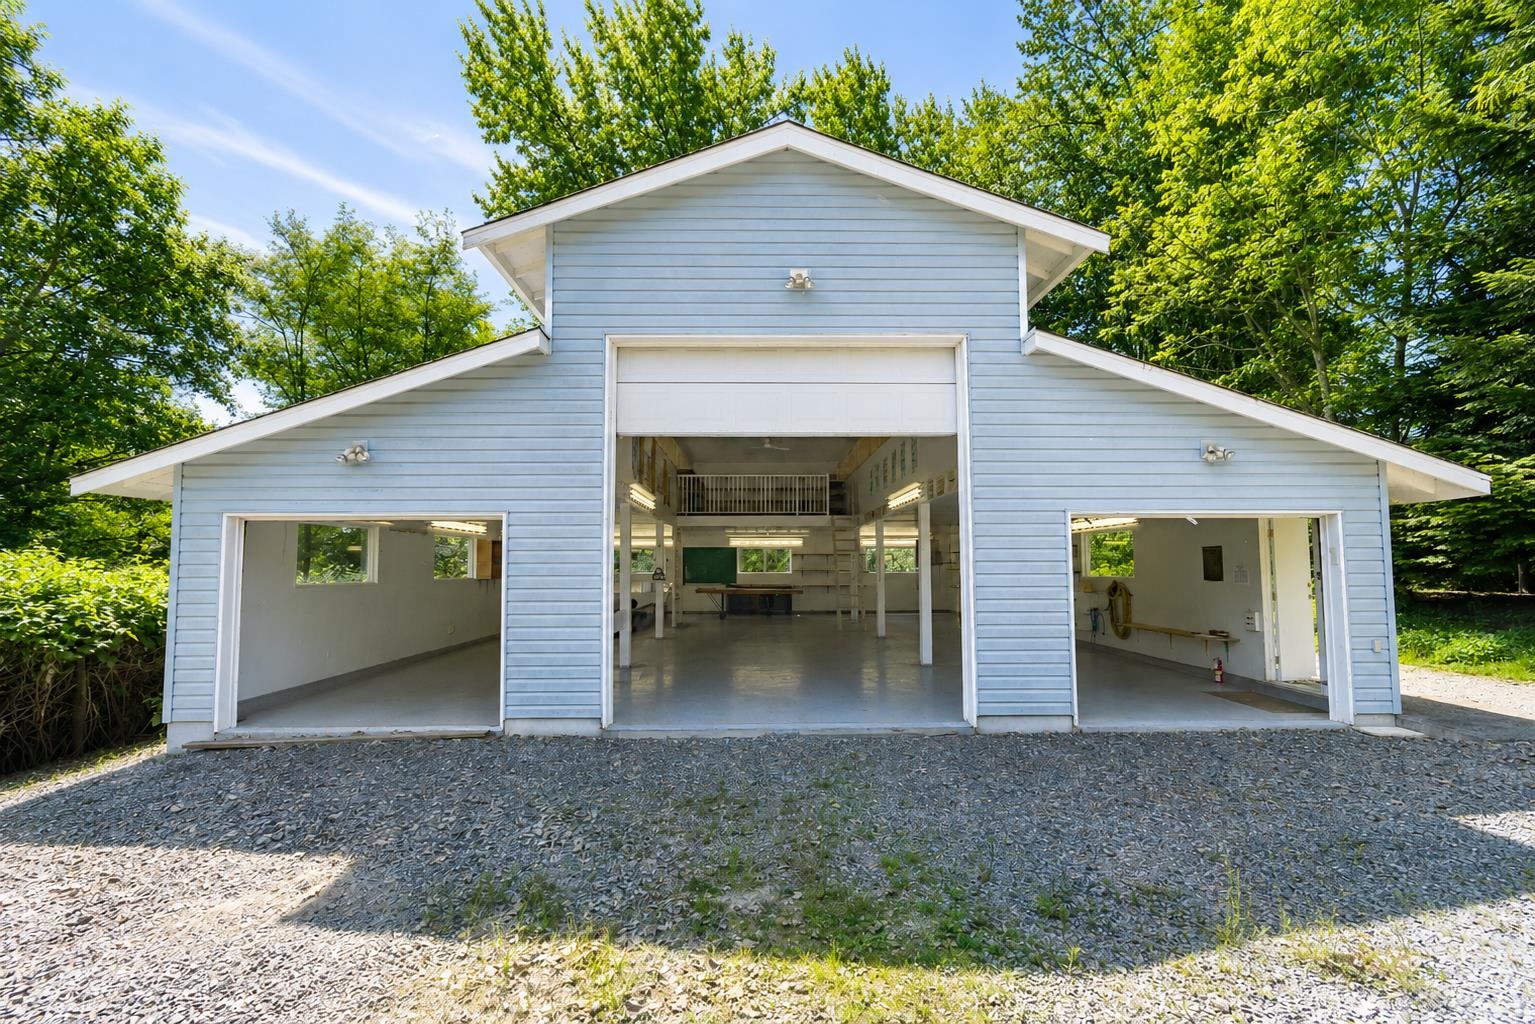
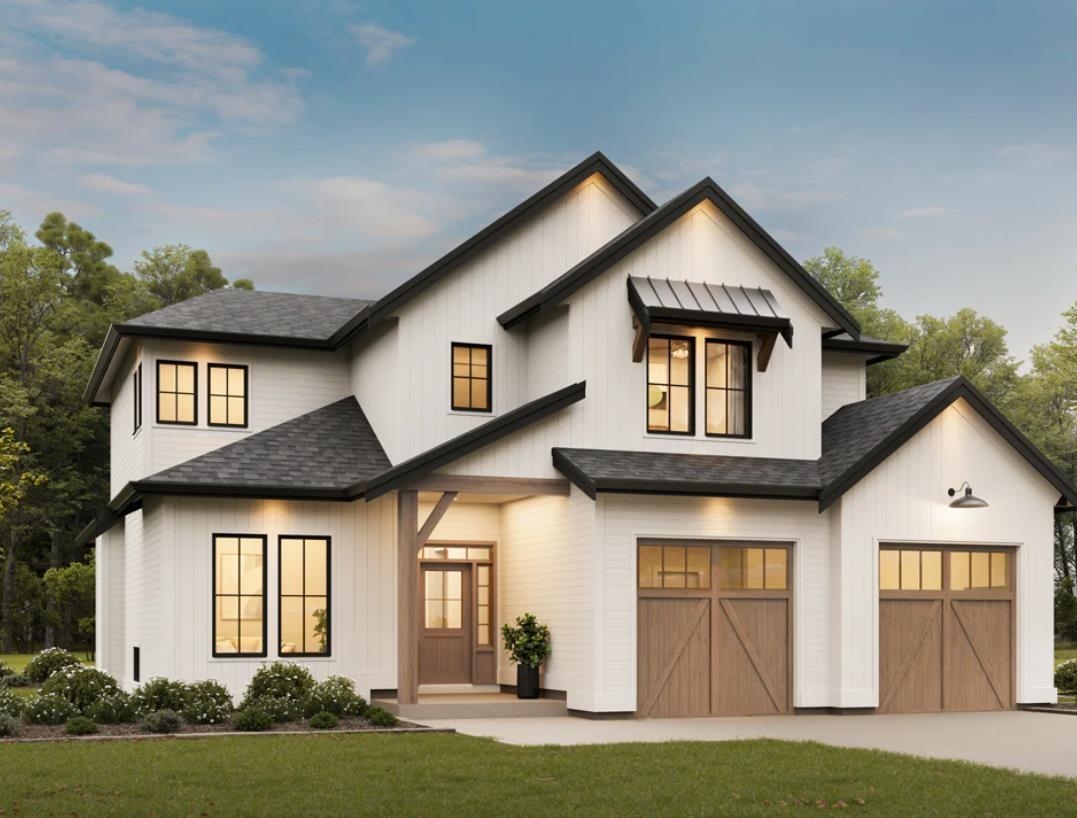
21154 Crush Crescent
Willoughby Heights · House · MLS® R3130831
$2,339,0001.35 acres · 1949
An acre and a third on a quiet crescent inside Willoughby Heights, with a 1949 house of 2,768 square feet and a three-bay workshop with a service pit. SR-2 zoned and not in the Agricultural Land Reserve, with development on every side of it. Land like this inside the municipality’s busiest plan area is finite; the house is the smaller part of the story. Worth a Property Intelligence Report before anyone does anything.
Property tax $10,655 a year
 13
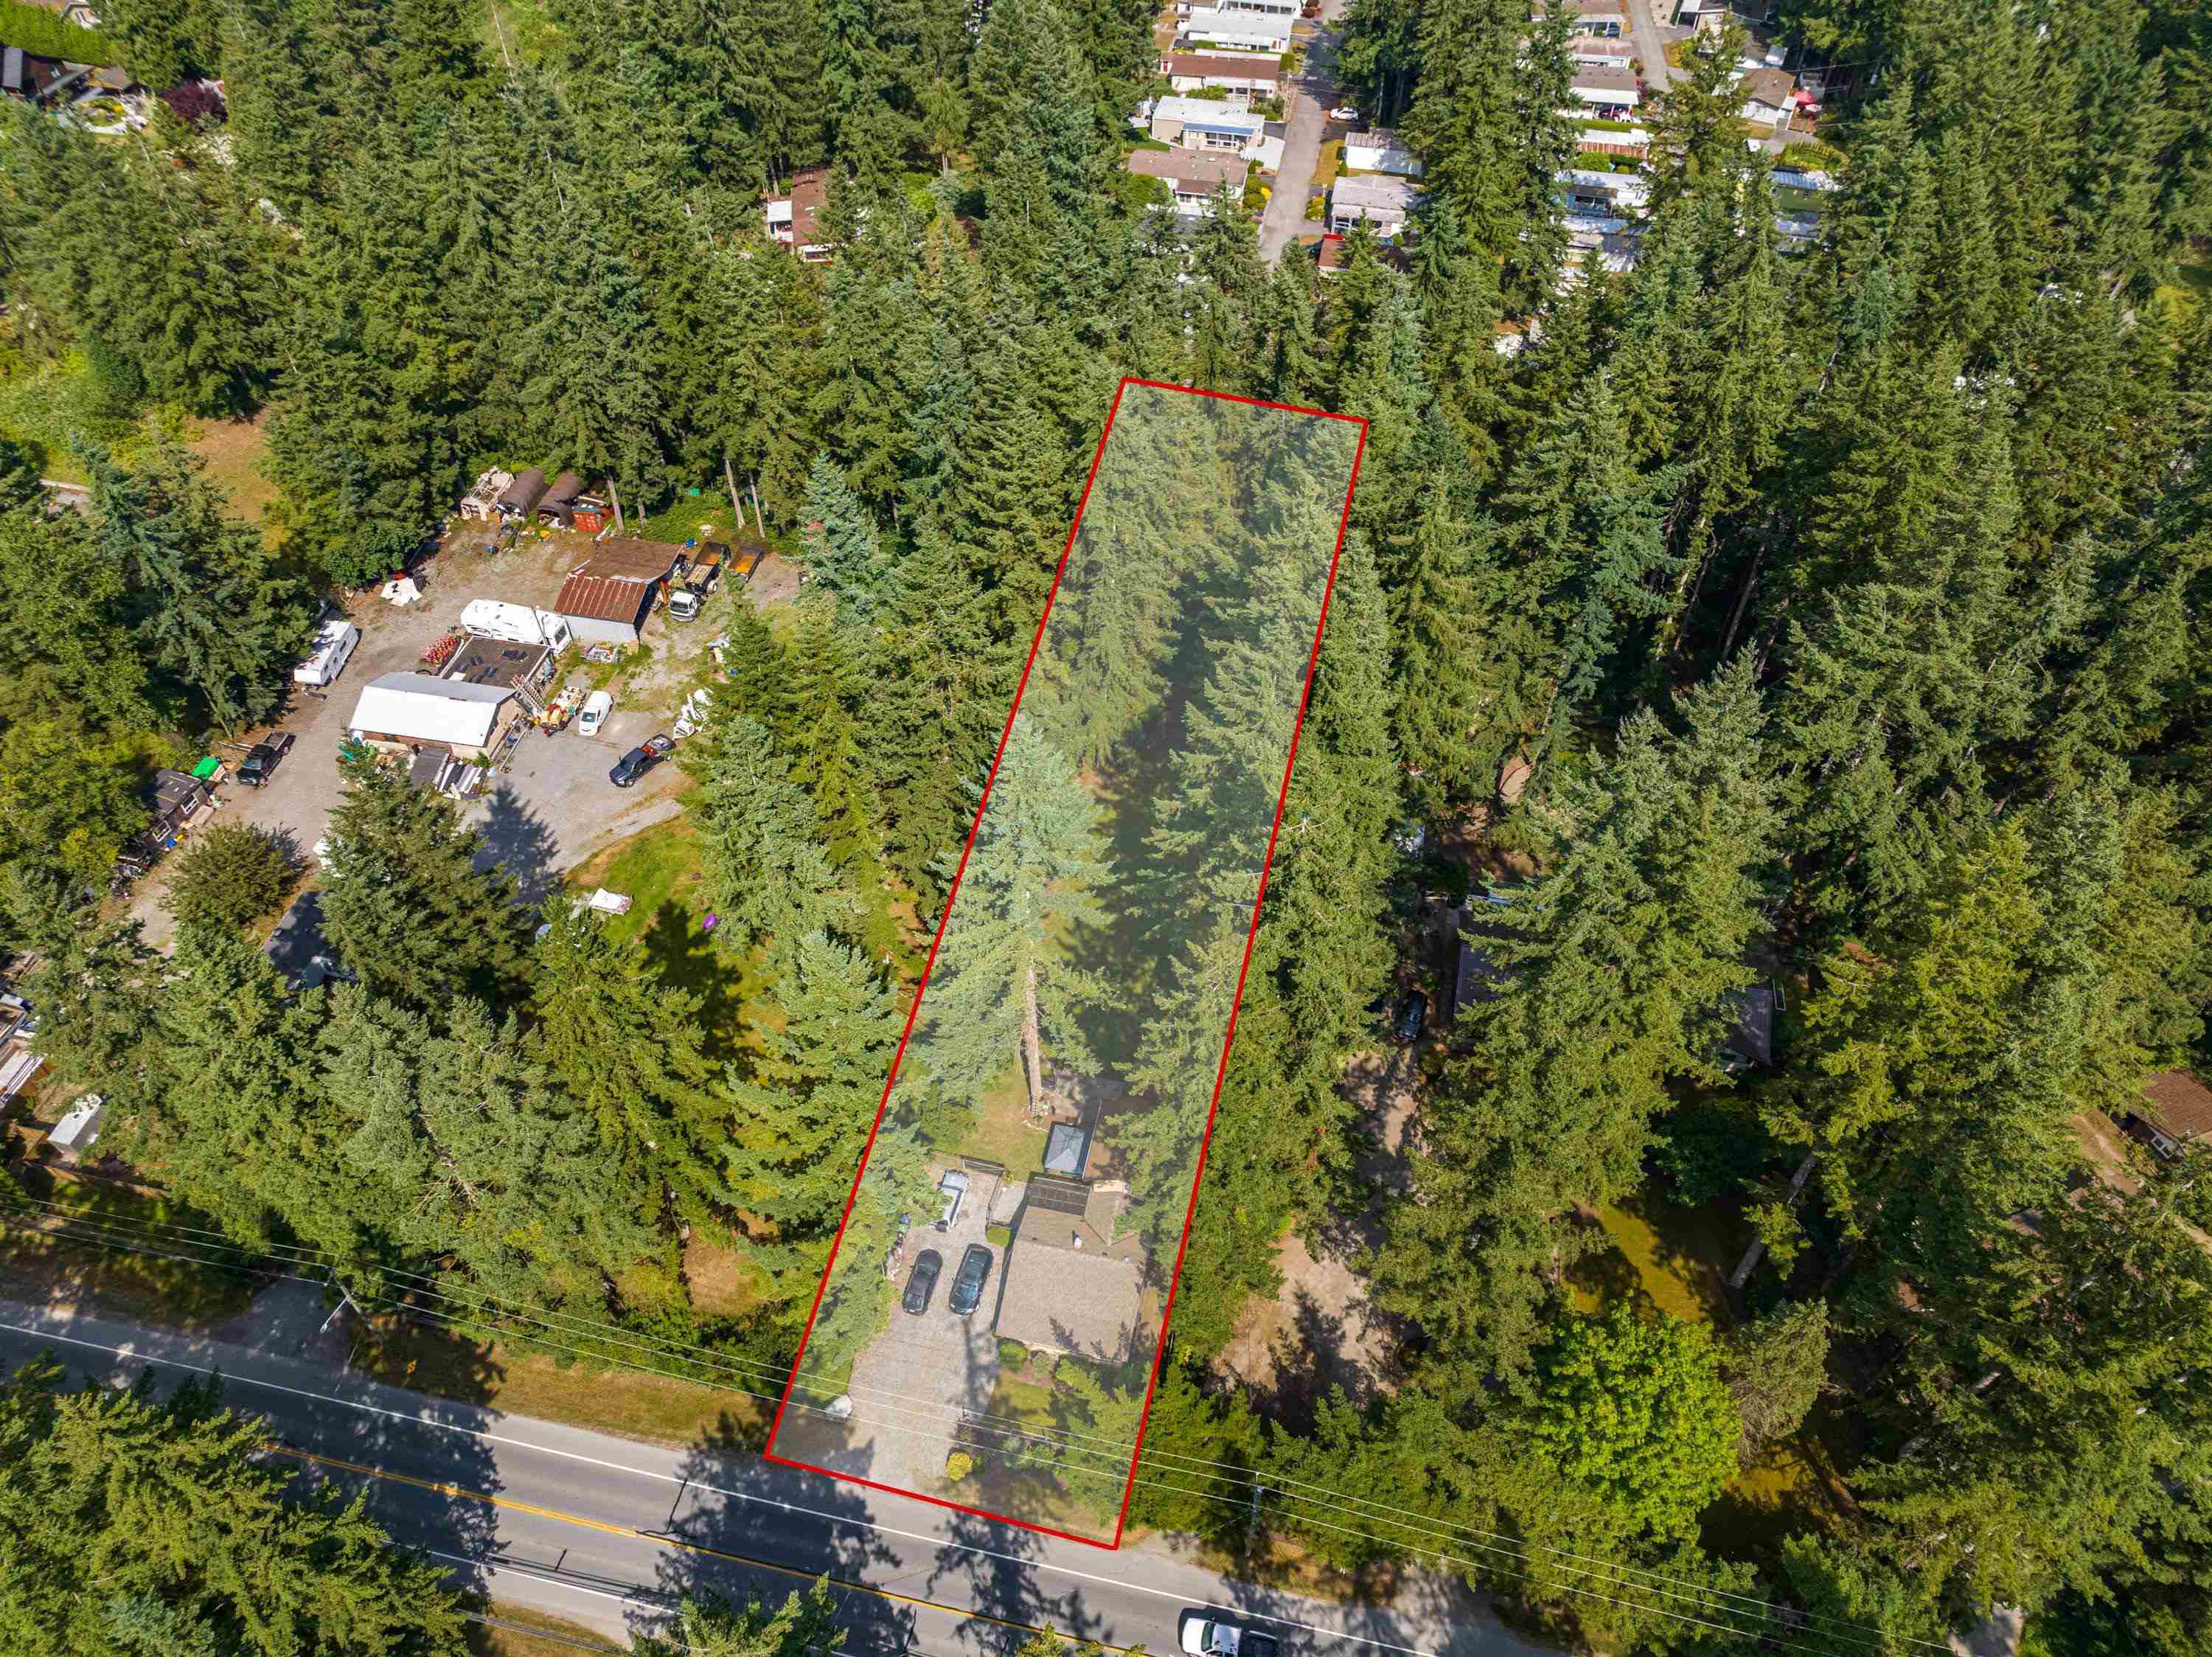
23124 96 Avenue
Fort Langley · House · MLS® R3148865
$1,449,900Acreage · 1950
A 1950 house on acreage in Fort Langley for under a million and a half. The village carries the highest apartment benchmark in Langley at $762,800, which tells you what scarcity does here. Land plus an old house plus this address is about as scarce as Langley gets.
Property tax $6,698 a year
 14
2552 200 Street
Brookswood · House · MLS® R3135211
$2,700,000Acreage with water · 1952
Acreage with water in Brookswood, where the neighbourhood plans have been redrawn more than once and the density question is still live. The tax bill of $4,720 on a $2.7 million ask is the detail worth understanding here, and it is exactly what our land report is for.
Property tax $4,720 a year
 15
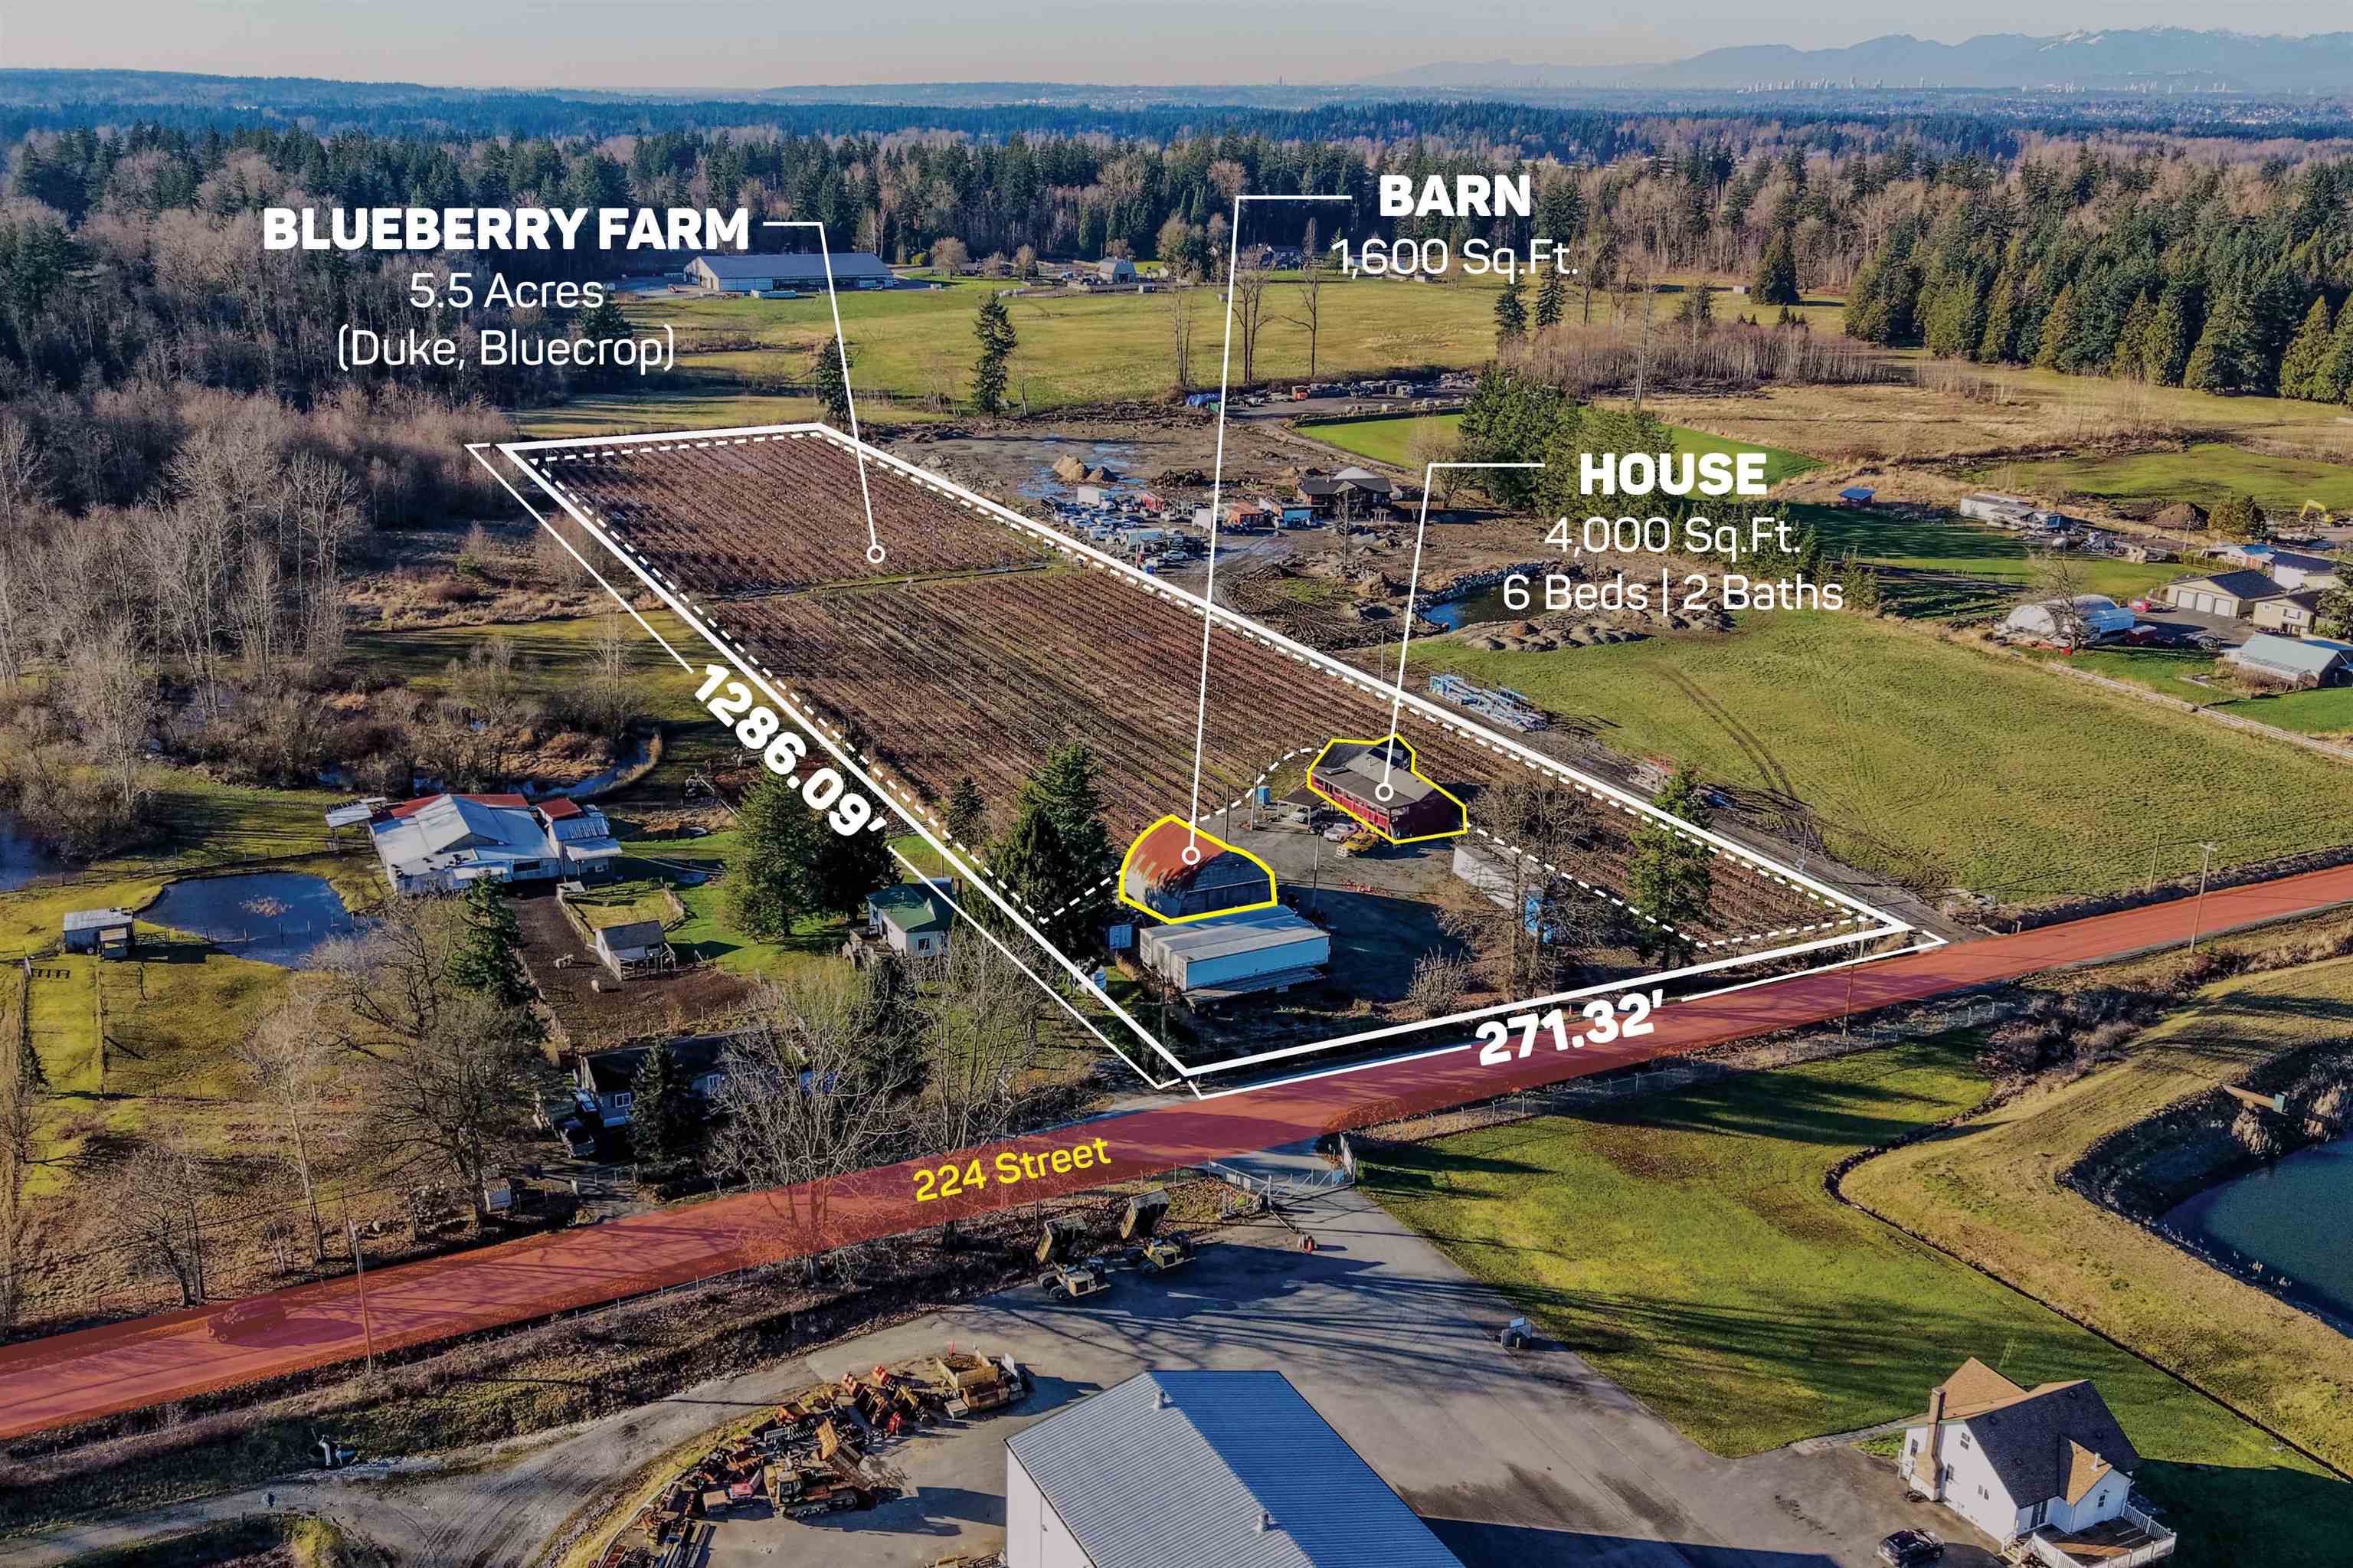
2157 224 Street
Campbell Valley · House · MLS® R3140912
$2,495,000Working land · 1952
Working ground in Campbell Valley with a 1952 house on it, 3,619 square feet. Land that is farmed carries rules that land which is merely large does not, and those rules decide what you can and cannot do long before price does.
Property tax $7,072 a year
How These Were Chosen
The working, so you can check it.
1,394 active Langley listings were read for the August 2026 edition, across every neighbourhood in the municipality. On 15 September 2026 all fifteen were checked against the live MLS® feed: thirteen were still listed at the same prices, two had left the market, and the two Willoughby Heights places were re-chosen from a fresh read of that neighbourhood’s 109 detached listings that day, measured against that day’s medians. On 16 September the tax test was tightened to residential class only, each dwelling type measured against its own type in its own neighbourhood, and picks 01 and 03 (a C-2 mixed-use building and a co-operative share, whose tax bills are not residential assessments) were replaced from fresh reads of Aldergrove (50 houses) and Walnut Grove (35 houses). On 19 September picks 04 and 05 were re-measured against fresh reads of Langley City’s attached market (103 condos, 39 townhouses) so that every card carries its group, median and tax year. Each one carries its exact dwelling type and its annual property tax,
both taken from the MLS® sheet rather than guessed. Homes are compared only
against others of the same type in the same neighbourhood, and only where at least
six such listings exist, so nothing is measured against an unlike set.
Property tax in British Columbia is assessed
value multiplied by the municipal rate, so within one town the tax bill tracks what
the assessor believes a home is worth. A price that sits well under the tax it
carries is the signal. It is a screen, not a verdict: a low price-to-tax ratio says a listing is
worth reading, and it can also mean the assessment is for something other than a house, which is why a
C-2 mixed-use building in Aldergrove that passed the arithmetic in August was taken off the list on 16 September. It does not by itself establish that a property is
below assessed value. We publish the ratio, not an assessed value, and we do not
call it an assessment. New construction is left out, because a home the assessor
has not yet valued has nothing to measure against.
A listing that fails these tests is simply
not here.
Listings courtesy of cooperating
brokerages via MLS® reciprocity. Selection and commentary are our own. Prices,
taxes and availability are as published on the MLS® sheet and change daily.
Nothing here is an appraisal.
Past editions
Each month’s Fifteen stays on the shelf as it was published, so anyone can check what we said against what happened.
Get the next Fifteen, and The Langley Market Report.
Each month, The Langley Market Report by email, with every new report we published that month and the next Fifteen. One email a month, and you can stop it any time.
Nothing else is sent, and never to anybody else.